Case Reports
. 2011 Apr 6;6(4):e18424.
doi: 10.1371/journal.pone.0018424.

Targeted morphoproteomic profiling of Ewing's sarcoma treated with insulin-like growth factor 1 receptor (IGF1R) inhibitors: response/resistance signatures

Affiliations
Case Reports

Targeted morphoproteomic profiling of Ewing's sarcoma treated with insulin-like growth factor 1 receptor (IGF1R) inhibitors: response/resistance signatures

Vivek Subbiah et al. PLoS One. .

Abstract

Background: Insulin-like growth factor 1 receptor (IGF1R) targeted therapies have resulted in responses in a small number of patients with advanced metastatic Ewing's sarcoma. We performed morphoproteomic profiling to better understand response/resistance mechanisms of Ewing's sarcoma to IGF1R inhibitor-based therapy.

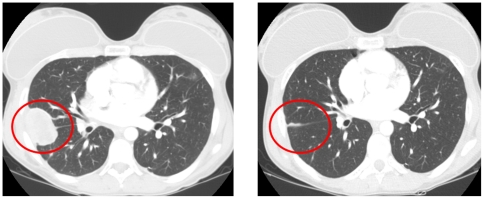
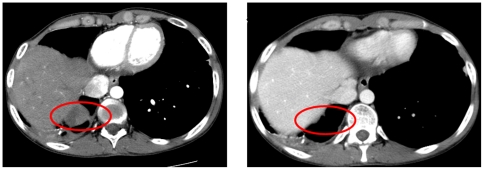
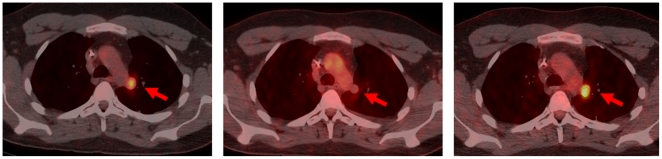
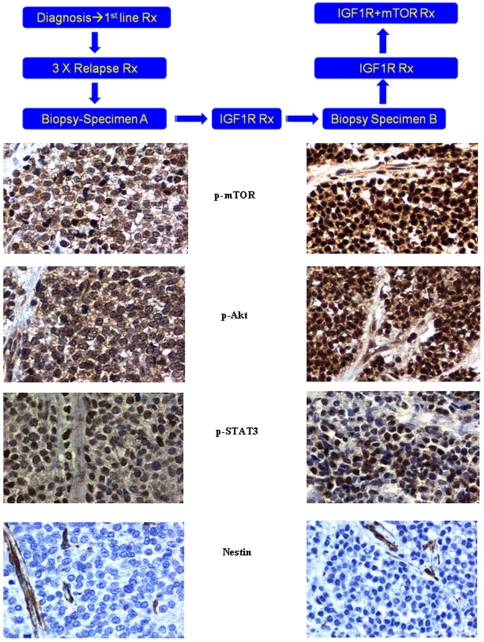
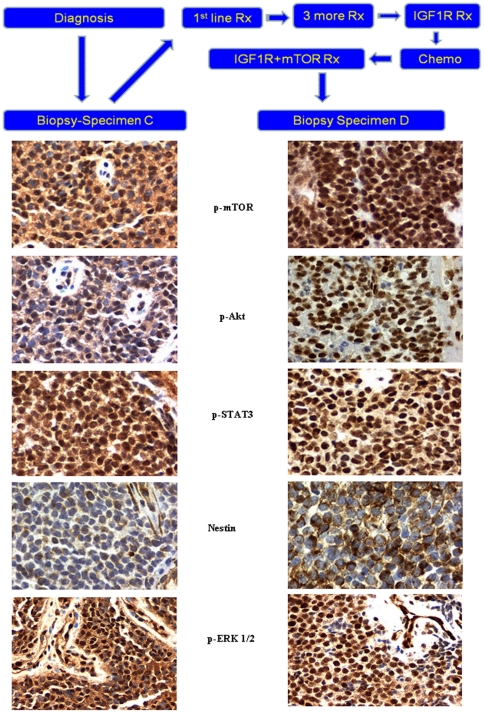
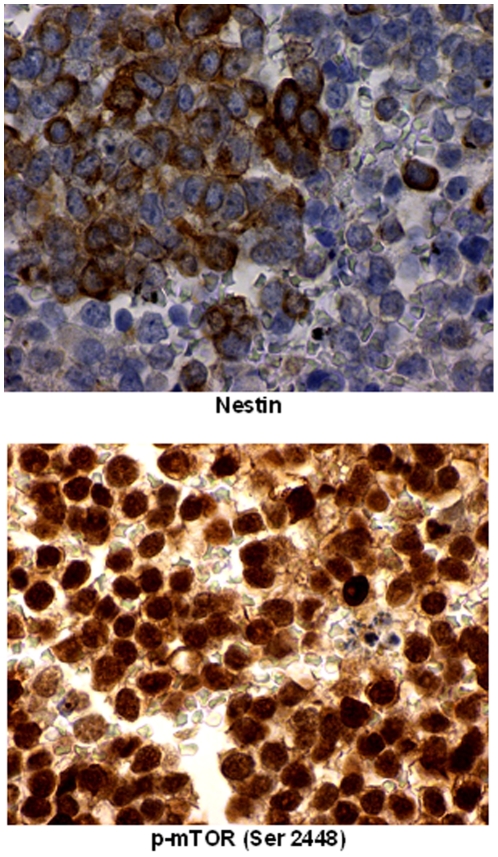
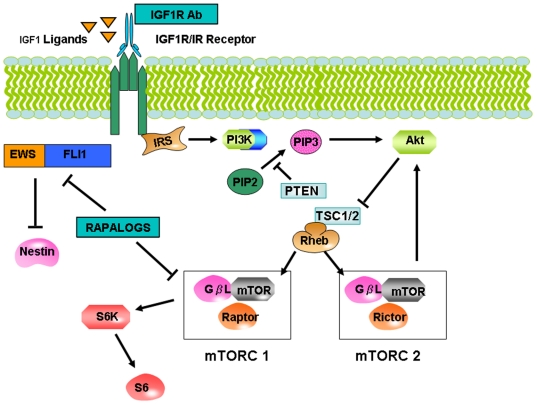
Methodology/principal findings: This pilot study assessed two patients with advanced Ewing's sarcoma treated with IGF1R antibody alone followed by combined IGF1R inhibitor plus mammalian target of rapamycin (mTOR) inhibitor treatment once resistance to single-agent IGF1R inhibitor developed. Immunohistochemical probes were applied to detect p-mTOR (Ser2448), p-Akt (Ser473), p-ERK1/2 (Thr202/Tyr204), nestin, and p-STAT3 (Tyr 705) in the original and recurrent tumor. The initial remarkable radiographic responses to IGF1R-antibody therapy was followed by resistance and then response to combined IGF1R plus mTOR inhibitor therapy in both patients, and then resistance to the combination regimen in one patient. In patient 1, upregulation of p-Akt and p-mTOR in the tumor that relapsed after initial response to IGF1R antibody might explain the resistance that developed, and the subsequent response to combined IGF1R plus mTOR inhibitor therapy. In patient 2, upregulation of mTOR was seen in the primary tumor, perhaps explaining the initial response to the IGF1R and mTOR inhibitor combination, while the resistant tumor that emerged showed activation of the ERK pathway as well.

Conclusion/significance: Morphoproteomic analysis revealed that the mTOR pathway was activated in these two patients with advanced Ewing's sarcoma who showed response to combined IGF1R and mTOR inhibition, and the ERK pathway in the patient in whom resistance to this combination emerged. Our pilot results suggests that morphoproteomic assessment of signaling pathway activation in Ewing's sarcoma merits further investigation as a guide to understanding response and resistance signatures.


Conflict of interest statement

Competing Interests: The authors have declared that no competing interests exist.

Figures

Figure 1
Figure 1. Imaging Responses in Ewing's sarcoma patient 1.
CT of the thorax in patient 1 with Ewing's sarcoma response to IGF1R antibody (R1507) alone . Left panel shows pre-treatment CT scan of the thorax showing metastatic Ewing's sarcoma in the lung. Right panel: Six weeks after IGF1R antibody (R1507) therapy shows regression of tumor.
Figure 2
Figure 2. Imaging Responses in Ewing's sarcoma patient 1.
CT of the thorax in patient 1 with Ewing's sarcoma response to IGF1R antibody (IMCA12)+ mTOR (Temsirolimus) combination. Left panel shows pre-treatment CT scan of the thorax showing metastatic Ewing's sarcoma in the lung. Right panel: Nine months after IGF1R antibody+ mTOR inhibitor (IMCA12+ Temsirolimus) therapy showing continued response.
Figure 3
Figure 3. Imaging Responses in Ewing's sarcoma patient 2.
FDG PET /CT in patient 2 with Ewing's sarcoma response to IMCA12+Temsirolimus combination and then emergence of resistance. Left panel shows pre-treatment FDG PET/CT scan of the thorax showing metastatic Ewing's sarcoma in the lung. Middle panel shows FDG PET/CT response after 8 weeks of treatment. Right panel shows re-emergence of resistance 16 weeks after IGF1R antibody+ mTOR (IMCA12+ Temsirolimus) therapy.
Figure 4
Figure 4. Schematic clinical history and immunohistochemistry of patient 1.
Schematic history of patient 1 depicting time line of first biopsy(Biopsy A) and second biopsy (Biopsy B). Immunohistochemistry Patient 1. Pre-IGF1R treatment (Specimen A) and Post –IGF1R treatment (Specimen B) p-mTOR,p-AKT,p-STAT3 and nestin probes. Pre-treatment digital images (left hand frames, Specimen A) reveal: primarily cytoplasmic and plasmalemmal expression of p-mTOR (Ser 2448) and p-Akt (Ser 473) consistent with preponderance of mTORC1 pathway; occasional p-STAT3 (Tyr 705) in tumoral nuclei (up to ∼20%) and absence of cytoplasmic nestin. Post-treatment digital images (right hand frames, Specimen B) reveal: primarily nuclear p-mTOR (Ser 2448) and p-Akt (Ser 473) consistent with mTORC2 pathway preponderance; moderate increase in number of tumor cells with nuclear p-STAT3 (Tyr 705) (from 0 up to ∼50% in some regions) and absence of cytoplasmic nestin (endothelial cells serve as internal control). Original magnifications x400.
Figure 5
Figure 5. Schematic clinical history and immunohistochemistry of patient 2.
Schematic history of patient 2 depicting time line of first biopsy (Biopsy C) and second biopsy (Biopsy D). Immunohistochemistry Patient 2. Pre-IGF1R treatment (Specimen C) and Post –IGF1R+ mTOR (Specimen D) p-mTOR,p-AKT,p-STAT3, nestin probes and p-ERK1/2. Pre-treatment digital images (left hand frames, Specimen C) reveal: primarily cytoplasmic but with some nuclear expression of both p-mTOR (Ser 2448) and p-Akt (Ser 473) indicative of both mTORC1 and mTORC2 pathways; nuclear p-STAT3 (Tyr 705) in the majority of tumoral nuclei and faint but detectable constitutive nestin expression. Post-treatment digital images (right hand frames, Specimen D) reveal: preponderance of nuclear p-mTOR (Ser 2448) and p-Akt (Ser 473) consistent with upregulation of the mTORC2 pathway; persistence of p-STAT3 (Tyr 705)expression in tumoral nuclei and an increase in cytoplasmic nestin expression, the latter consistent with temsirolimus therapy. Constitutive activation of the Ras/Raf /ERK pathway is noted in both specimens by p-ERK 1/2 (Thr202/Tyr204) expression, showing nuclear translocation. Original magnifications x400.
Figure 6
Figure 6. High magnification immunohistochemistry showing nuclear versus cytoplasmic staining.
Post-IGF1R+ mTOR inhibitor therapy specimen from patient 2 in higher magnification (600X) showing brown chromogenic signal in nestin with predominantly cytoplasmic staining in the top panel and mTOR (Ser 2448) with predominant nulclear staining in the bottom panel.
Figure 7
Figure 7. Simplified Insulin-like growth factor 1 receptor (IGF1R) and mTORC1 and mTORC2 signaling in relation with EWS-FLI1.
Insulin Receptor substrate 1 (IRS1) and Phosphatidylinositol 3-kinases (PI3K) are activated by Insulin and/or IGF1 signaling at the insulin receptor level. PDK1 and Akt are recruited to the plasma membrane by products of PI3K, PIP2, PIP3 (phosphatidylinositol 3,4,5 trisphosphate and phosphatidylinositol 3,4 bisphosphate). After this event there is phosphorylation and activation of Akt by mTORC2 complex (mTOR + mLST8+ Rictor). This leads to a chain of activation of numerous targets by Akt. The TSC1/2 complex is also phosphorylated in this fashion. By the mechanism inactivation of TSC2's GAP activity for the small G protein Rheb is initiated. Now mTORC1 complex (mTOR + mLST8+Raptor) is activated by GTP-bound Rheb and phosphorylates proteins like S6K. This starts a negative feedback loop to modulate auto-activity, through S6K-mediated pathway decrease in the activation of PI3K. IGF1R antibody inhibits IGF1R signaling and rapalogs (Temsirolimus in this case) inhibit mTORC1 short term, and eventually inhibit mTORC 2 with chronic exposure, and also suppresses EWS-FLI1 which drives tumorigenesis in Ewing's sarcoma. EWS-FLI1 suppresses nestin.

References

    1. Balamuth NJ, Womer RB. Ewing's sarcoma. Lancet Oncol. 2010;11:184–192. - PubMed
    1. Smith MA, Seibel NL, Altekruse SF, Ries LA, Melbert DL, et al. Outcomes for children and adolescents with cancer: challenges for the twenty-first century. J Clin Oncol. 2010;28:2625–2634. - PMC - PubMed
    1. Subbiah V, Anderson P, Lazar AJ, Burdett E, Raymond K, et al. Ewing's sarcoma: standard and experimental treatment options. Curr Treat Options Oncol. 2009;10:126–140. - PubMed
    1. Subbiah V, Anderson PM. Targeted Therapy of Ewing's Sarcoma. Sarcoma. 2010;Volume 2011 (2011) Article ID 686985, doi:10.1155/2011/686985. - PMC - PubMed
    1. Ludwig JA. Ewing sarcoma: historical perspectives, current state-of-the-art, and opportunities for targeted therapy in the future. Curr Opin Oncol. 2008;20:412–418. - PubMed

Publication types