

The (mis)reporting of statistical results in psychology journals
- PMID: 21494917
- PMCID: PMC3174372
- DOI: 10.3758/s13428-011-0089-5
The (mis)reporting of statistical results in psychology journals
Abstract
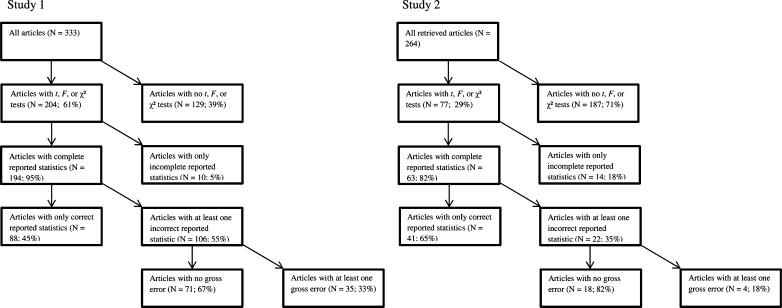
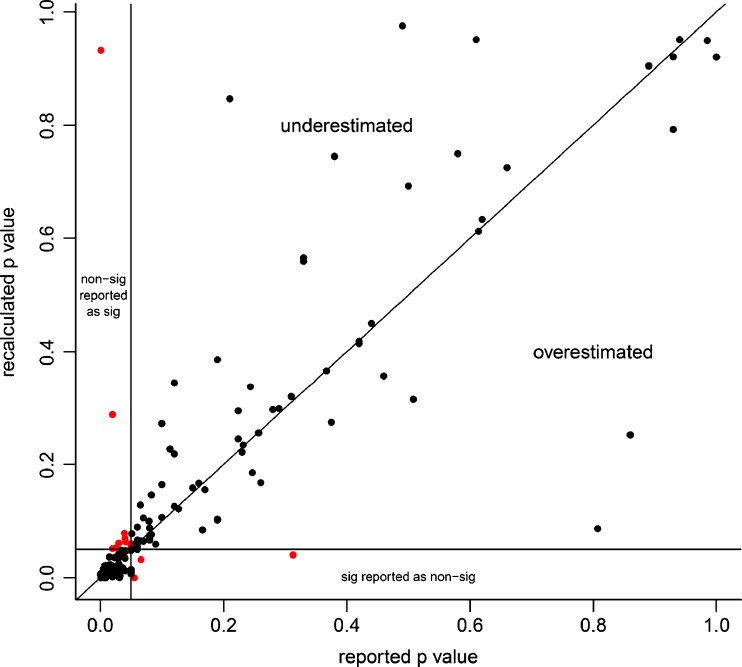
In order to study the prevalence, nature (direction), and causes of reporting errors in psychology, we checked the consistency of reported test statistics, degrees of freedom, and p values in a random sample of high- and low-impact psychology journals. In a second study, we established the generality of reporting errors in a random sample of recent psychological articles. Our results, on the basis of 281 articles, indicate that around 18% of statistical results in the psychological literature are incorrectly reported. Inconsistencies were more common in low-impact journals than in high-impact journals. Moreover, around 15% of the articles contained at least one statistical conclusion that proved, upon recalculation, to be incorrect; that is, recalculation rendered the previously significant result insignificant, or vice versa. These errors were often in line with researchers' expectations. We classified the most common errors and contacted authors to shed light on the origins of the errors.
Figures

References
-
- American Psychological Association . Publication Manual of the American Psychological Association. 5. Washington, DC: Author; 2001.
-
- American Psychological Association . Publication Manual of the American Psychological Association. 6. Washington, DC: Author; 2010.
-
- Bates, D., & Sarkar, D. (2007). lme4: Linear mixed-effects models using S4 classes (R package Version 0.999375-32) [Computer software]. Retrieved from http://cran.r-project.org/web/packages/lme4/index.html
-
- Borenstein M, Hedges LV, Higgins JPT, Rothstein HR. Introduction to meta-analysis. Chichester, U.K.: Wiley; 2009.
Publication types
MeSH terms
LinkOut - more resources
Full Text Sources
Medical
