

Bias in estimating accuracy of a binary screening test with differential disease verification
- PMID: 21495059
- PMCID: PMC3115446
- DOI: 10.1002/sim.4232
Bias in estimating accuracy of a binary screening test with differential disease verification
Abstract
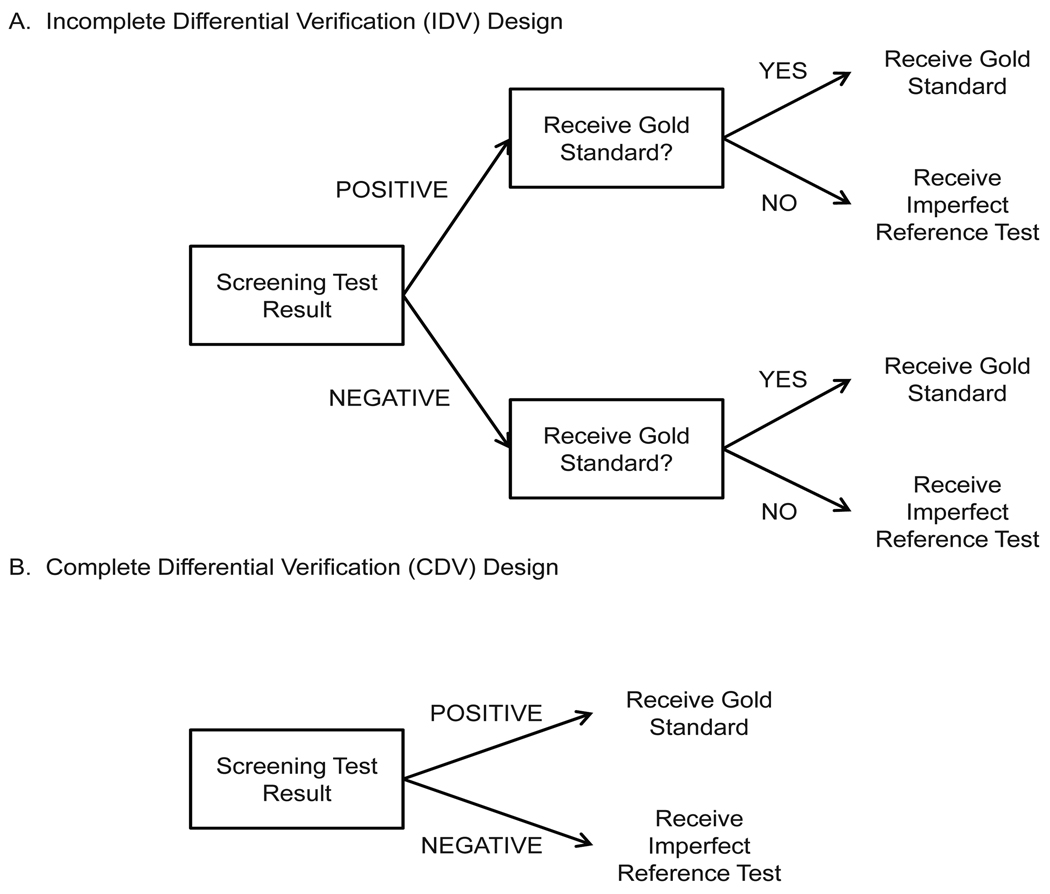
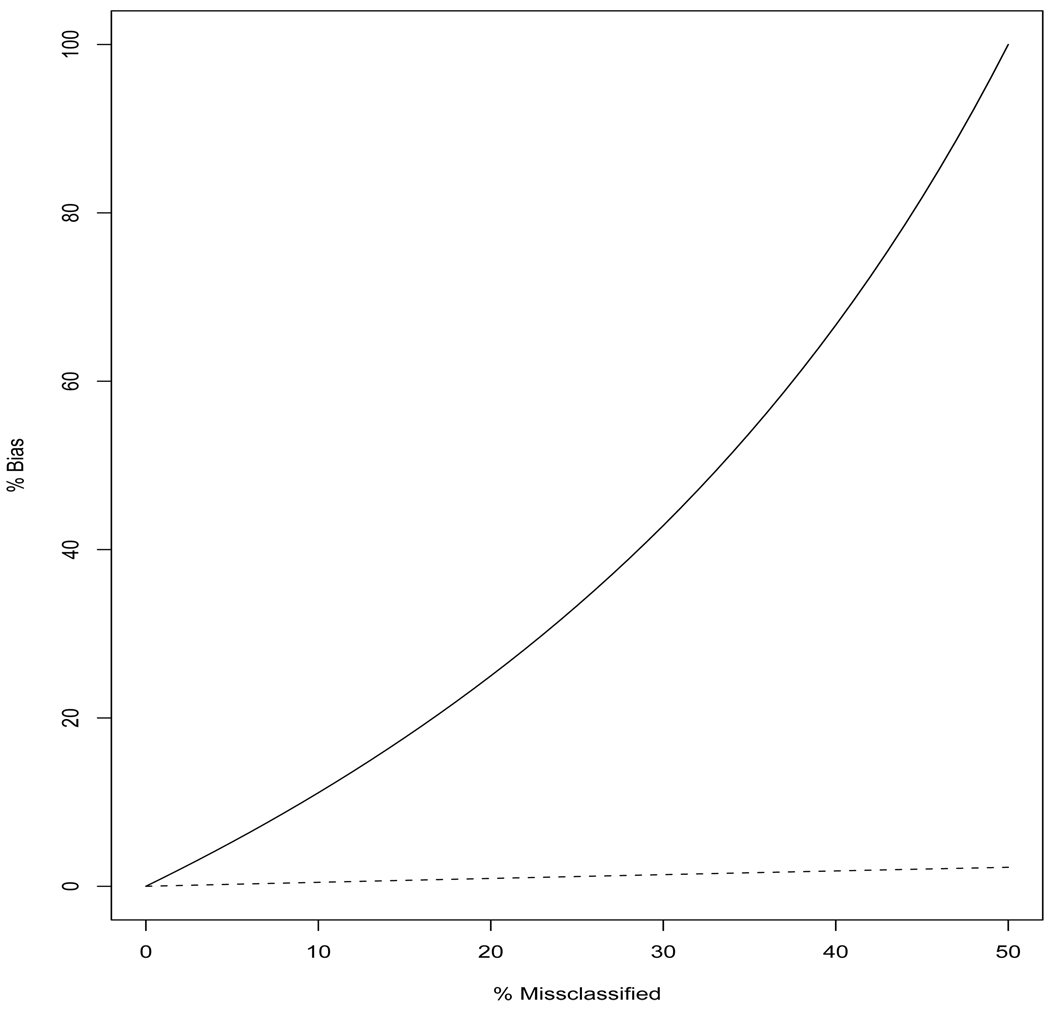
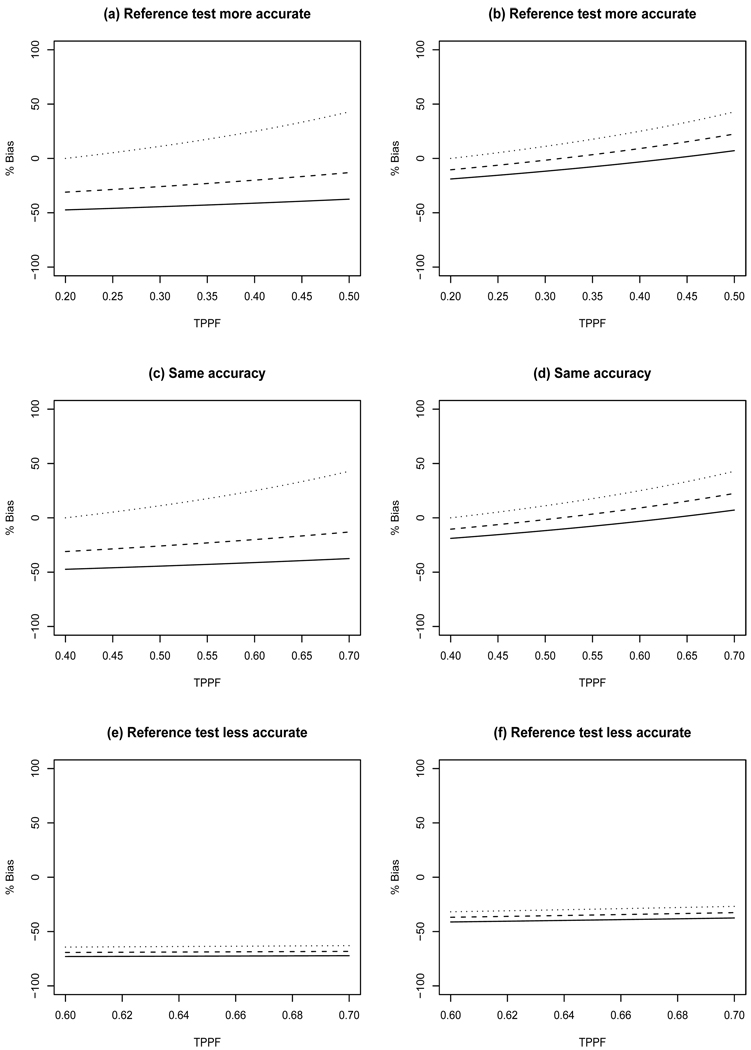
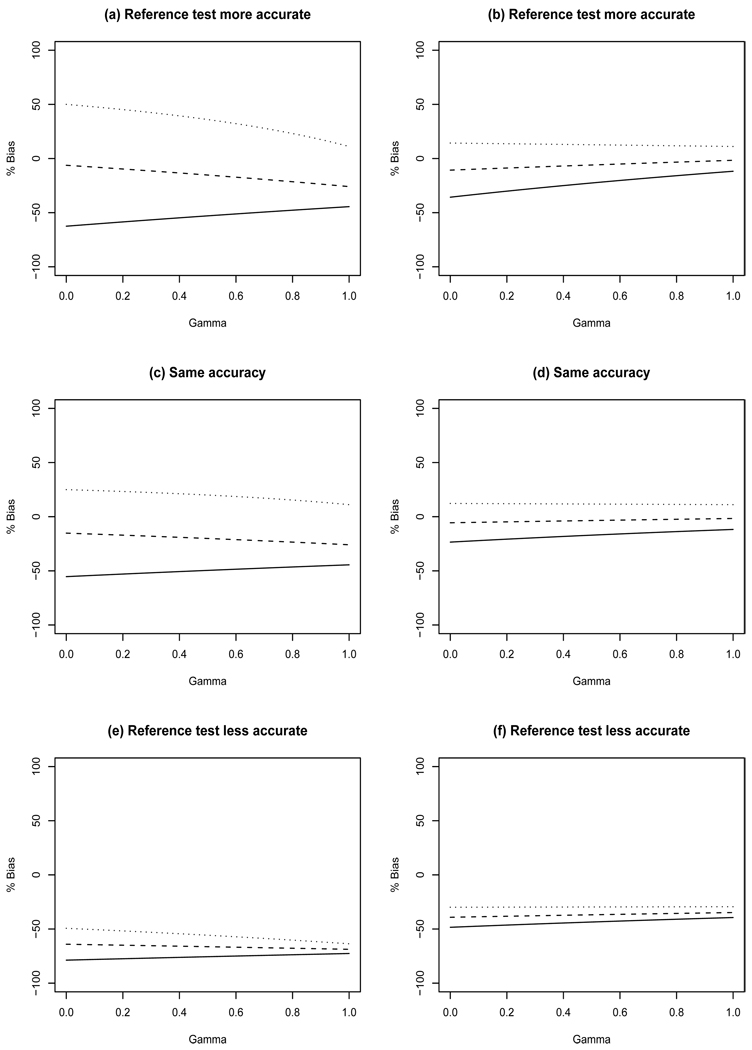
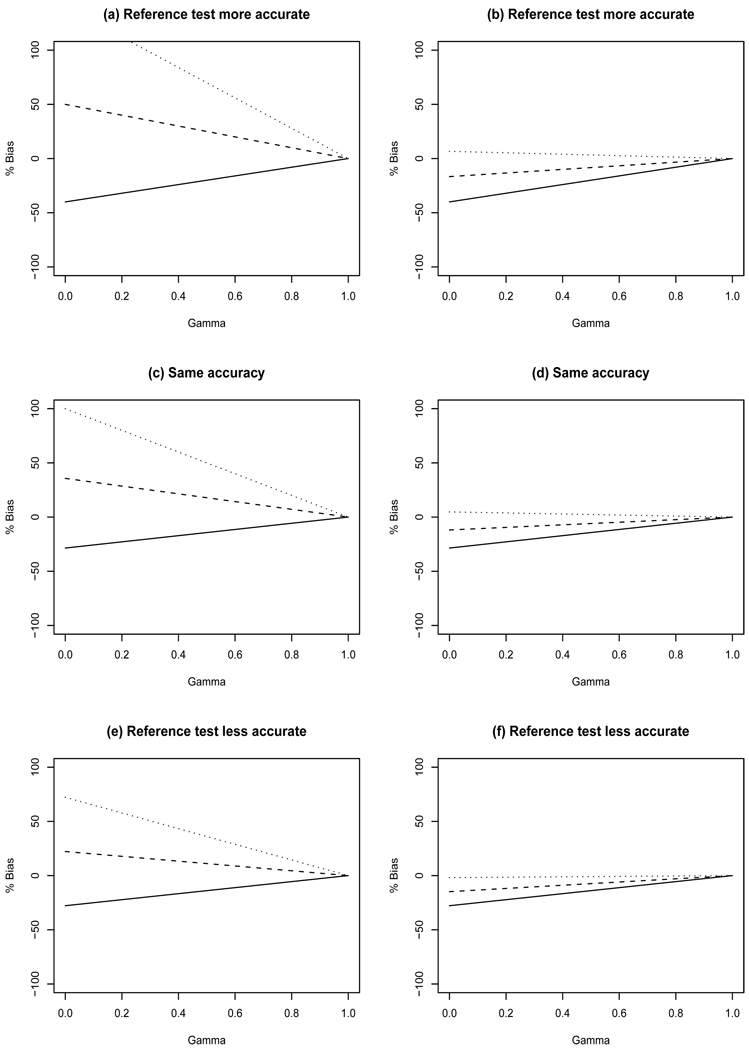
Sensitivity, specificity, positive and negative predictive value are typically used to quantify the accuracy of a binary screening test. In some studies, it may not be ethical or feasible to obtain definitive disease ascertainment for all subjects using a gold standard test. When a gold standard test cannot be used, an imperfect reference test that is less than 100 per cent sensitive and specific may be used instead. In breast cancer screening, for example, follow-up for cancer diagnosis is used as an imperfect reference test for women where it is not possible to obtain gold standard results. This incomplete ascertainment of true disease, or differential disease verification, can result in biased estimates of accuracy. In this paper, we derive the apparent accuracy values for studies subject to differential verification. We determine how the bias is affected by the accuracy of the imperfect reference test, the percent who receive the imperfect reference standard test not receiving the gold standard, the prevalence of the disease, and the correlation between the results for the screening test and the imperfect reference test. It is shown that designs with differential disease verification can yield biased estimates of accuracy. Estimates of sensitivity in cancer screening trials may be substantially biased. However, careful design decisions, including selection of the imperfect reference test, can help to minimize bias. A hypothetical breast cancer screening study is used to illustrate the problem.
Copyright © 2011 John Wiley & Sons, Ltd.
Figures
References
-
- Lewin JM, Hendrick RE, D’Orsi CJ, Isaacs PK, Moss LJ, Karellas A, Sisney GA, Kuni CC, Cutter GR. Comparison of full-field digital mammography with screen film mammography for cancer detection: results of 4,945 paired examinations. Radiology. 2001;218:873–880. - PubMed
-
- Lijmer JG, Mol BW, Heisterkamp S, Bonsel GJ, Prins MH, van der Meulen JHP, Bossuyt PM. Empirical evidence of design-related bias in studies of diagnostic tests. JAMA. 1999;282:1061–1066. - PubMed
Publication types
MeSH terms
Grants and funding
LinkOut - more resources
Full Text Sources
Medical