

The interrelationships of glycemic control measures: HbA1c, glycated albumin, fructosamine, 1,5-anhydroglucitrol, and continuous glucose monitoring
- PMID: 21496193
- PMCID: PMC3193556
- DOI: 10.1111/j.1399-5448.2011.00764.x
The interrelationships of glycemic control measures: HbA1c, glycated albumin, fructosamine, 1,5-anhydroglucitrol, and continuous glucose monitoring
Abstract
Objectives: To describe the interrelationships of glycemic control measures: hemoglobin A1c (HbA1c), glycated albumin, fructosamine, 1,5-anhydroglucitrol (1,5-AG), and continuous glucose monitoring (CGM) in children and adolescents with type 1 diabetes.
Methods: In total, 26 subjects of age 4-17 had HbA1c measurement followed within 14 d by three laboratory measures of glycemia and the collection of CGM glucose data (N = 21).
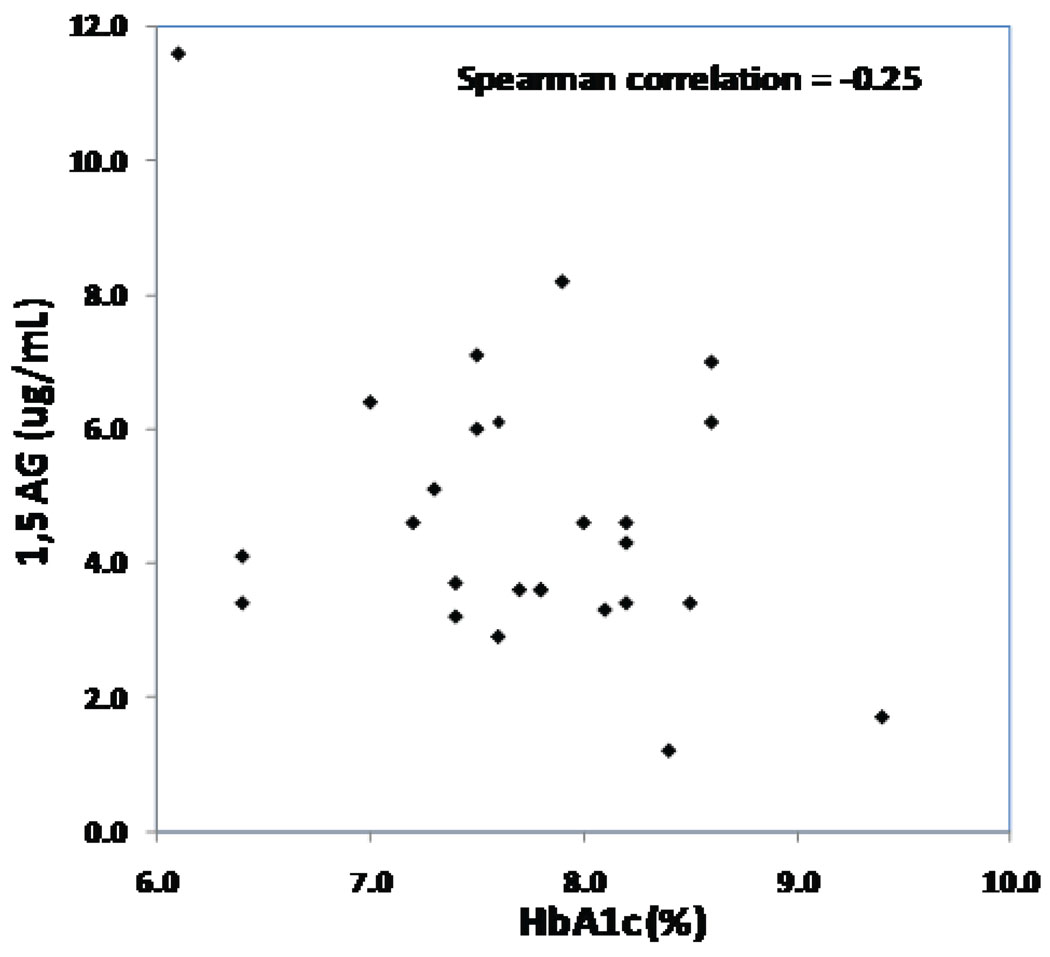
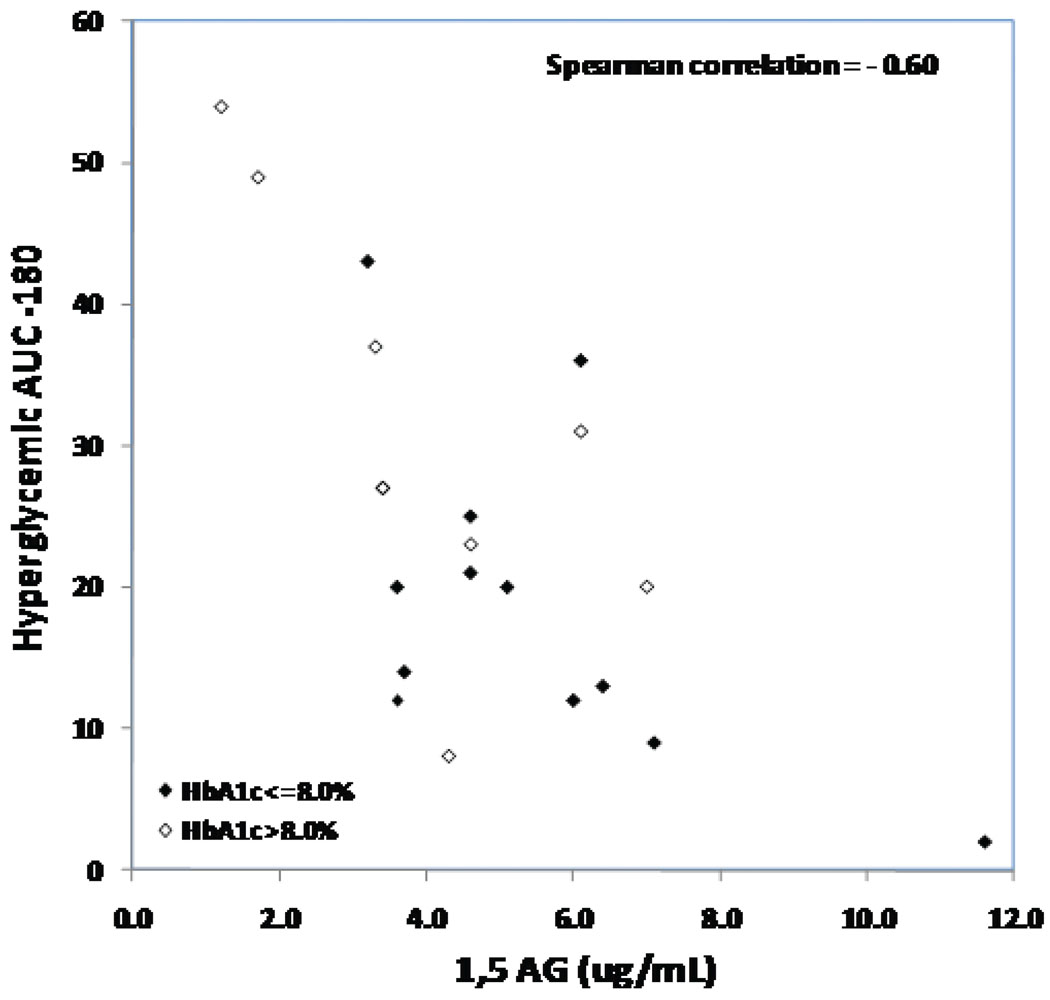
Results: Glycated albumin and fructosamine levels had a higher correlation with each other than with HbA1c. The correlation of 1,5-AG with HbA1c was lower (absolute r value = 0.25). All four measures had a similar degree of correlation with CGM-measured mean glucose (absolute r value = 0.50-0.56) and with hyperglycemic area under the curve (AUC) at 180 mg/dL (0.50-0.60).
Conclusion: Each of the four measures (i.e., HbA1c, glycated albumin, fructosamine, and 1,5-AG) had a similar correlation with mean glucose and hyperglycemic AUC-180. 1,5-AG did not correlate with hyperglycemic AUC-180 better than did HbA1c.
© 2011 John Wiley & Sons A/S.
Figures
References
-
- Buse JB, Freeman JLR, Edelman SV, Jovanovic L, McGill JB. Serum 1,5-Anhydroglucitol (GlycoMark™): A Short-Term Glycemic Marker. Diabetes Technol Ther. 2003;5:355–363. - PubMed
-
- Koenig RJ, Peterson CM, Jones RL, Saudek C, Lehrman M, Cerami A. Correlation of glucose regulation and hemoglobin AIc in diabetes mellitus. N Engl J Med. 1976;295:417–420. - PubMed
-
- Rohlfing CL, Wiedmeyer HM, Little RR, England JD, Tennill A, Goldstein DE. Defining the relationship between plasma glucose and HbA1c: analysis of glucose profiles and HbA1c in the Diabetes Control and Complications Trial. Diabetes Care. 2002;25:275–278. - PubMed
-
- Tahara Y, Shima K. Kinetics of HbA1c, glycated albumin, and fructosamine and analysis of their weight functions against preceding plasma glucose level. Diabetes Care. 1995;18:440–447. - PubMed
-
- McGill JB, Cole TG, Nowatzke W, Houghton S, Ammirati EB, Gautille T, et al. Circulating 1,5-Anhydroglucitol Levels in Adult Patients With Diabetes Reflect Longitudinal Changes of Glycemia. Diabetes Care. 2004;27:1859–1865. - PubMed
Publication types
MeSH terms
Substances
Grants and funding
- U10 HD041918/HD/NICHD NIH HHS/United States
- M01 RR000069/RR/NCRR NIH HHS/United States
- HD041918-01/HD/NICHD NIH HHS/United States
- HD041908-01/HD/NICHD NIH HHS/United States
- M01 RR000059/RR/NCRR NIH HHS/United States
- U10 HD041919/HD/NICHD NIH HHS/United States
- U01 HD041890/HD/NICHD NIH HHS/United States
- U10 HD041915/HD/NICHD NIH HHS/United States
- U10 HD041908/HD/NICHD NIH HHS/United States
- M01 RR00069/RR/NCRR NIH HHS/United States
- RR00059/RR/NCRR NIH HHS/United States
- U10 HD041890/HD/NICHD NIH HHS/United States
- HD041890/HD/NICHD NIH HHS/United States
- HD041906-01/HD/NICHD NIH HHS/United States
- M01 RR000070/RR/NCRR NIH HHS/United States
- RR00070-41/RR/NCRR NIH HHS/United States
- M01 RR006022/RR/NCRR NIH HHS/United States
- RR 06022/RR/NCRR NIH HHS/United States
- U10 HD041906/HD/NICHD NIH HHS/United States
- HD041915-01/HD/NICHD NIH HHS/United States
- HD041919-01/HD/NICHD NIH HHS/United States
LinkOut - more resources
Full Text Sources
Medical
Molecular Biology Databases
