

Relative percentage and zonal distribution of mesenchymal progenitor cells in human osteoarthritic and normal cartilage
- PMID: 21496249
- PMCID: PMC3132059
- DOI: 10.1186/ar3320
Relative percentage and zonal distribution of mesenchymal progenitor cells in human osteoarthritic and normal cartilage
Abstract
Introduction: Mesenchymal stem cells (MSC) are highly attractive for use in cartilage regeneration. To date, MSC are usually recruited from subchondral bone marrow using microfracture. Recent data suggest that isolated cells from adult human articular cartilage, which express the combination of the cell-surface markers CD105 and CD166, are multi-potent mesenchymal progenitor cells (MPC) with characteristics similar to MSC. MPC within the cartilage matrix, the target of tissue regeneration, may provide the basis for in situ regeneration of focal cartilage defects. However, there is only limited information concerning the presence/abundance of CD105+/CD166+ MPC in human articular cartilage. The present study therefore assessed the relative percentage and particularly the zonal distribution of cartilage MPC using the markers CD105/CD166.
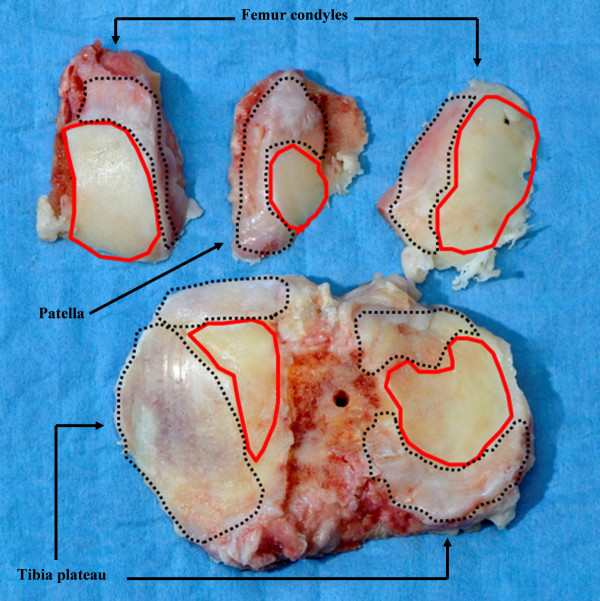
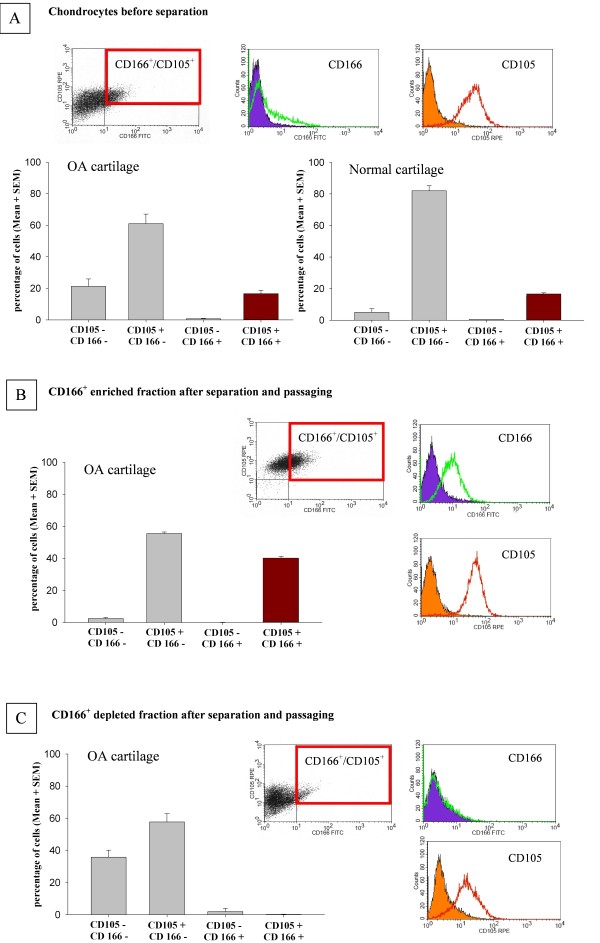
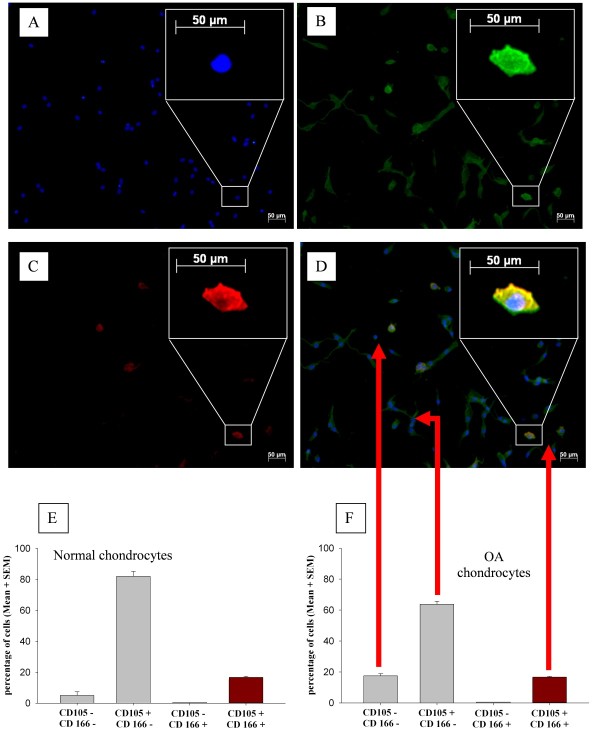
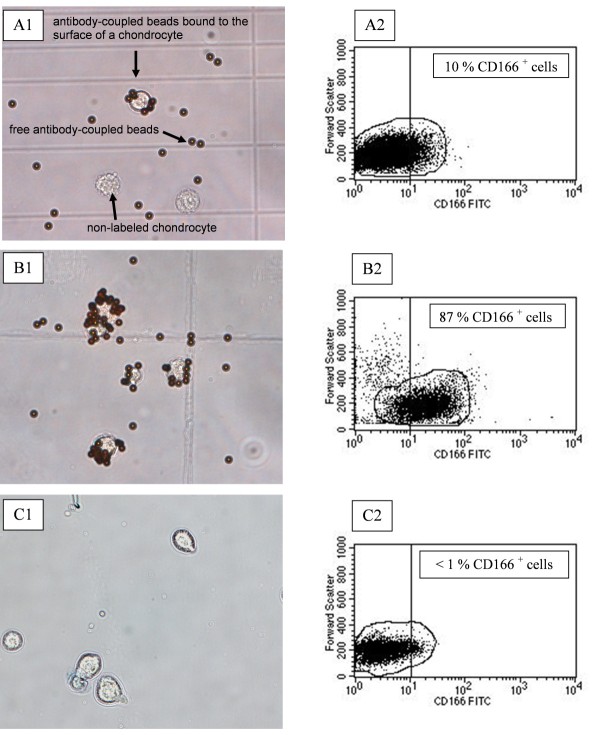
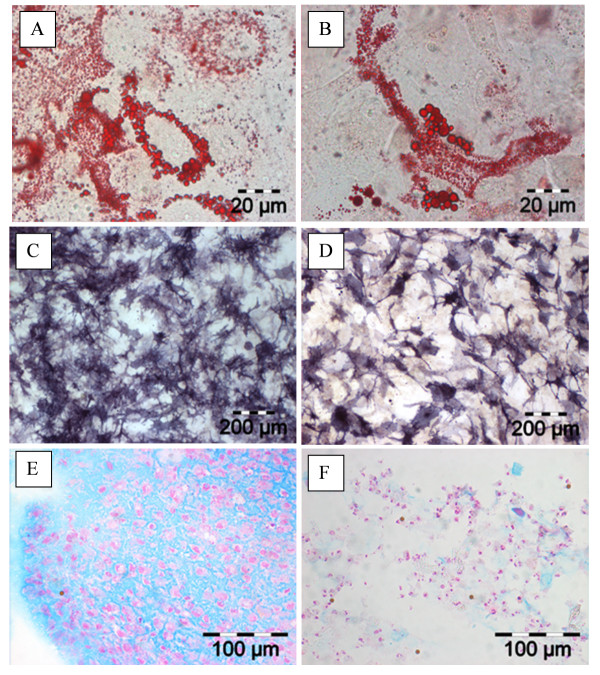
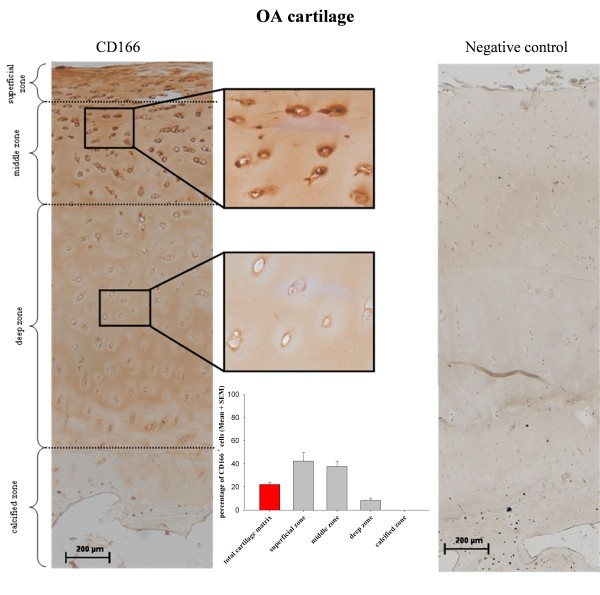
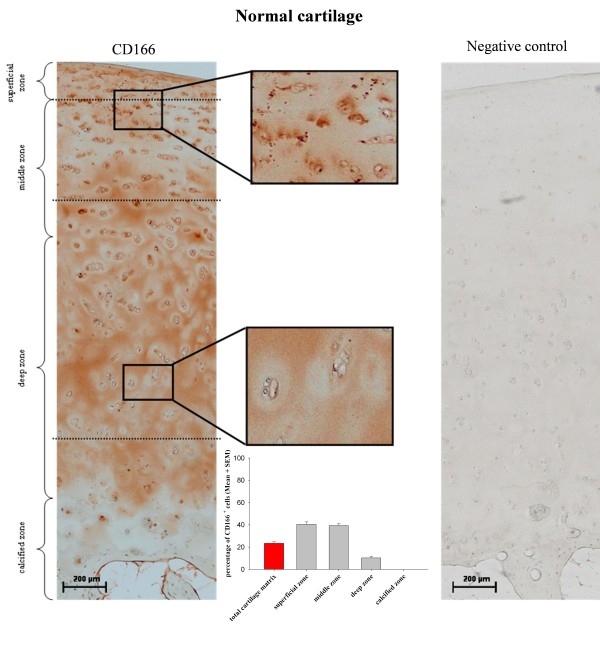
Methods: Specimens of human osteoarthritic (OA; n = 11) and normal (n = 3) cartilage were used for either cell isolation or immunohistochemistry. Due to low numbers, isolated cells were expanded for 2 weeks and then analyzed by flow cytometry (FACS) or immunofluorescence in chamber slides for the expression of CD105 and CD166. Following immunomagnetic separation of CD166+/- OA cells, multi-lineage differentiation assays were performed. Also, the zonal distribution of CD166+ cells within the matrix of OA and normal cartilage was analyzed by immunohistochemistry.
Results: FACS analysis showed that 16.7 ± 2.1% (mean ± SEM) of OA and 15.3 ± 2.3 of normal chondrocytes (n.s.) were CD105+/CD166+ and thus carried the established MPC marker combination. Similarly, 13.2% ± 0.9% and 11.7 ± 2.1 of CD105+/CD166+cells, respectively, were identified by immunofluorescence in adherent OA and normal chondrocytes. The CD166+ enriched OA cells showed a stronger induction of the chondrogenic phenotype in differentiation assays than the CD166+ depleted cell population, underlining the chondrogenic potential of the MPC. Strikingly, CD166+ cells in OA and normal articular cartilage sections (22.1 ± 1.7% and 23.6% ± 1.4%, respectively; n.s.) were almost exclusively located in the superficial and middle zone.
Conclusions: The present results underline the suitability of CD166 as a biomarker to identify and, in particular, localize and/or enrich resident MPC with a high chondrogenic potential in human articular cartilage. The percentage of MPC in both OA and normal cartilage is substantially higher than previously reported, suggesting a yet unexplored reserve capacity for regeneration.
Figures
Similar articles
-
Identification of mesenchymal progenitor cells in normal and osteoarthritic human articular cartilage.Arthritis Rheum. 2004 May;50(5):1522-32. doi: 10.1002/art.20269. Arthritis Rheum. 2004. PMID: 15146422
-
Progenitor Cells from Cartilage: Grade Specific Differences in Stem Cell Marker Expression.Int J Mol Sci. 2017 Aug 12;18(8):1759. doi: 10.3390/ijms18081759. Int J Mol Sci. 2017. PMID: 28805694 Free PMC article.
-
[Experimental study on CD105+/CD166+ cells and its chondrogenic potential in early osteoarthritis cartilage].Zhongguo Xiu Fu Chong Jian Wai Ke Za Zhi. 2013 Jul;27(7):793-9. Zhongguo Xiu Fu Chong Jian Wai Ke Za Zhi. 2013. PMID: 24063165 Chinese.
-
Mesenchymal stem cells for cartilage repair in osteoarthritis.Stem Cell Res Ther. 2012 Jul 9;3(4):25. doi: 10.1186/scrt116. Stem Cell Res Ther. 2012. PMID: 22776206 Free PMC article. Review.
-
[Effects of cartilage progenitor cells and microRNA-140 on repair of osteoarthritic cartilage injury].Zhongguo Xiu Fu Chong Jian Wai Ke Za Zhi. 2019 May 15;33(5):650-658. doi: 10.7507/1002-1892.201806060. Zhongguo Xiu Fu Chong Jian Wai Ke Za Zhi. 2019. PMID: 31090363 Free PMC article. Review. Chinese.
Cited by
-
Early changes in the knee of healer and non-healer mice following non-invasive mechanical injury.J Orthop Res. 2017 Mar;35(3):524-536. doi: 10.1002/jor.23413. Epub 2016 Sep 16. J Orthop Res. 2017. PMID: 27591401 Free PMC article.
-
Isolation and Analysis of Matched Osteoarthritic Cartilage Progenitor Cells and Bone Marrow Mesenchymal Stem Cells.Cureus. 2025 Mar 19;17(3):e80844. doi: 10.7759/cureus.80844. eCollection 2025 Mar. Cureus. 2025. PMID: 40255792 Free PMC article.
-
Adipose, Bone Marrow and Synovial Joint-Derived Mesenchymal Stem Cells for Cartilage Repair.Front Genet. 2016 Dec 20;7:213. doi: 10.3389/fgene.2016.00213. eCollection 2016. Front Genet. 2016. PMID: 28066501 Free PMC article. Review.
-
The influence of tissue microenvironment on stem cell-based cartilage repair.Ann N Y Acad Sci. 2016 Nov;1383(1):21-33. doi: 10.1111/nyas.13170. Epub 2016 Jul 27. Ann N Y Acad Sci. 2016. PMID: 27464254 Free PMC article. Review.
-
Probing Multicellular Tissue Fusion of Cocultured Spheroids-A 3D-Bioassembly Model.Adv Sci (Weinh). 2021 Nov;8(22):e2103320. doi: 10.1002/advs.202103320. Epub 2021 Oct 10. Adv Sci (Weinh). 2021. PMID: 34632729 Free PMC article.
References
-
- Grogan SP, Barbero A, Diaz-Romero J, Cleton-Jansen AM, Soeder S, Whiteside R, Hogendoorn PC, Farhadi J, Aigner T, Martin I, Mainil-Varlet P. Identification of markers to characterize and sort human articular chondrocytes with enhanced in vitro chondrogenic capacity. Arthritis Rheum. 2007;56:586–595. doi: 10.1002/art.22408. - DOI - PubMed
Publication types
MeSH terms
Substances
LinkOut - more resources
Full Text Sources
Other Literature Sources
Medical
Research Materials
Miscellaneous
