. 2011 Apr 15;145(2):312-21.
doi: 10.1016/j.cell.2011.03.013.

Thermal robustness of signaling in bacterial chemotaxis

Affiliations

Thermal robustness of signaling in bacterial chemotaxis

Olga Oleksiuk et al. Cell. .

Abstract

Temperature is a global factor that affects the performance of all intracellular networks. Robustness against temperature variations is thus expected to be an essential network property, particularly in organisms without inherent temperature control. Here, we combine experimental analyses with computational modeling to investigate thermal robustness of signaling in chemotaxis of Escherichia coli, a relatively simple and well-established model for systems biology. We show that steady-state and kinetic pathway parameters that are essential for chemotactic performance are indeed temperature-compensated in the entire physiological range. Thermal robustness of steady-state pathway output is ensured at several levels by mutual compensation of temperature effects on activities of individual pathway components. Moreover, the effect of temperature on adaptation kinetics is counterbalanced by preprogrammed temperature dependence of enzyme synthesis and stability to achieve nearly optimal performance at the growth temperature. Similar compensatory mechanisms are expected to ensure thermal robustness in other systems.


Figures

Figure 1
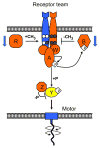
Figure 1. Signaling Pathway in E. coli Chemotaxis and Temperature Effects on Pathway Components
Sensory complexes consist of mixed teams of receptors (only one type of receptor is shown for simplicity) that jointly regulate the autophosphorylation activity of CheA with the help of an adaptor protein CheW. Receptors are methylated and demethylated/deamidated by the adaptation enzymes CheR and CheB, respectively, at four specific sites per receptor monomer (white circles, unmodified glutamates; dark grey circles, methylated glutamates or glutamines). The response regulator CheY is phosphorylated by CheA and dephosphorylated by CheZ. CheY-P binds to flagellar motors to induce a CW switch. Color code indicates temperature effects observed in this study: activation of proteins or protein complexes by increasing temperature is shown in orange and inactivation in blue. Together, CheA and CheW are shown to be temperature-activated, because of the positive effect of temperature on kinase activity, although individual contributions of the two proteins were not characterized. An increase in the adapted level of CheY-P in wild-type cells is indicated in yellow. Blue arrows indicate the reduction in the expression levels of CheR and CheB with growth temperature.
Figure 2
Figure 2. Temperature Effects on Chemoreceptor Activity and Methylation
(A, B) Temperature dependence of the pre-stimulus level of CheZ-CFP/CheY-YFP FRET (A) and of EC50 (B) for Tar expressed from a plasmid, as the sole receptor, either in CheR+CheB+ (VS181) or in cheR cheB (VH1) cells in one of the indicated modification states. Cells were pre-adapted to the test temperature in buffer and stimulated by step-like addition of varying amounts of MeAsp to determine dose responses. FRET was calculated from the changes in the YFP to CFP fluorescence ratio upon stimulation as illustrated in Figure S1C. The values of EC50 in CheR+CheB+ cells were corrected for partial adaptation during flow experiments. Note that EC50 for TarEEEE could not be determined. (C) Distribution of modification states of Tar expressed as the sole receptor in CheR+CheB+ (VS181 [pVS88/pVS123]) cells that were adapted to indicated temperatures in the buffer. Methylation was determined from the receptor mobility on an SDS-PAGE gel. Mobilities of Tar receptors with indicated number of glutamine substitutions (corresponding to EEEE, QEEE, QEQE, QEQQ, and QQQQ receptors) are shown by vertical dashed lines. Note that effects of modification on receptor mobility may depend on position of the modified residue, which presumably explains additional peaks observed between standards. The mobility of QEQE and QEQQ receptors is similar. The effect of modification on receptor mobility does not depend on the prior incubation temperature. All curves were normalized to their integral area. (D) Pre-stimulus FRET levels in VS150 cells expressing TarQEQQ from the native chromosomal location of the tar gene, or co-expressing it with TarQEEE encoded on a plasmid at a ratio TarQEEE:TarQEQQ of ≈0.4. Note that TarQEQQ cells still express low levels of minor receptors Trg and Aer, and also differ in the level of Tar expression from cells used in Figure 2A, which is likely to explain the differences in the FRET level and in the details of temperature dependence between the two experiments. Error bars here and throughout the paper (unless specified otherwise) indicate standard errors of multiple biological replicates. See Figure S1 and Experimental Procedures and Supplemental Experimental Procedures for details of experiments and analyses.
Figure 3
Figure 3. Temperature Effects on CheY Dephosphorylation Rate and on the Pathway Output
(A) Temperature dependence of CheY-P dephosphorylation rate. Dephosphorylation rate was determined by fitting kinetics of the FRET decay in VH1 [pVS123/pVS88] cells upon rapid stimulation with 1 mM asparate. Inset Arrhenius plot of the same data and the corresponding linear fit. (B) Adapted FRET level (black circles, scaled by 10−1 compared to units used in Figure 2) and CW motor bias (blue squares) taken from (Paster and Ryu, 2008) as functions of temperature for wild-type cells. Inset Temperature dependence of motor sensitivity, defined as the inverse of the concentration of a constitutively active mutant CheY** that produces a CW motor bias of 0.5, based on published data (Turner et al., 1999). Units of motor sensitivity are μM−1. See also Figure S2.
Figure 4
Figure 4. Adaptation Time as a Function of Temperature
(A) Adaptation time, defined as recovery time to half of the initial FRET level upon addition of 10 μM (red circles), 100 μM (green squares), or 300 μM (blue diamonds) of MeAsp, for cells grown at 34°C. Data are fitted using an Arrhenius form AeΔE/kT (see text). (B) Arrhenius plot of the adaptation times in response to addition (closed symbols, replotted from A) and to subsequent removal (open symbols, same color code) of MeAsp after preceding adaptation. Data for removal of 300 μM MeAsp were not evaluated, because in most experiments adaptation to addition of this concentration was not followed until completion.
Figure 5
Figure 5. Swimming Velocity Dependence on Temperature
A dilute suspension of wild-type RP437 cells swimming near the coverslip surface was recorded at 60 fps using video phase microscopy. Swimming speed during runs was determined as described in Supplemental Experimental Procedures and averaged for each cell. Data from the population of 200–400 cells was then averaged for each temperature. Error bars indicate variation (standard deviation) among individual cells.
Figure 6
Figure 6. Growth Temperature Effects on Adaptation Kinetics
(A) Dependence of adaptation time (defined as in Figure 4) to 100 μM MeAsp on measurement temperature for cells grown at 37°C (red circles), 34°C (open green circles), and 30°C (open light blue squares). (B) Temperature dependence of the relative adaptation rate, defined as (adaptation time)−1 for cells grown at 37°C (red circles) or at the respective measurement temperature (open black squares). As in all preceding figures, X axis indicates measurement temperature. Arrow indicates compensation of the adaptation rate by the growth temperature. Also shown is the optimal adaptation rate as a function of temperature, which was simulated (light green diamonds) or calculated (yellow triangles) as described in Supplemental Experimental Procedures. All values are normalized to the respective value at 37°C.
Figure 7
Figure 7. Growth Temperature Regulation of Protein Levels
(A) Dependence of relative levels of CheR (red circles), CheB (green squares), and receptors (grey diamonds) on the growth temperature. Protein levels were measured by quantitative immunoblotting as described in Supplemental Experimental Procedures. (B) Dependence of adaptation rate, determined for 100 μM MeAsp at 20°C as in Figure 6, on the relative CheR/receptor ratio. Wild-type cultures grown at 27, 30, 34 or 37°C are show with red circles; the values for 30 to 37°C were calculated from the data in Figure 6A. The 34°C culture with different levels of CheR and CheB induction (0.001%, 0.003% or 0.01% L-arabinose) from a bicistronic construct pV144 is shown with black squares. All values in (A, B) are normalized to the respective values for the 37°C culture. (C) Ratio of endogenous mRNA levels of indicated genes in cultures of wild-type RP437 cells grown at 37°C or at 27°C. Ratio of relative mRNA levels corresponding to cheR and receptors at each temperature was determined using realtime PCR, and the values at 37°C were normalized by those at 27°C. (D) Levels of protein synthesis for plasmid-encoded Tar-YFP or CheR-YFP fusion constructs transcribed from pTrc promoter at the same induction in cultures of wild-type RP437 cells grown at 27°C (blue bars) or 37°C (pink bars). Protein expression was measured by flow cytometry and expressed in arbitrary units (AU). ‘Tap’ denotes fragment encoding translated tap gene upstream of cheR, whereas ‘nt-tap’ denotes the same fragment with mutated start codon, and ‘nt-tap*’ denotes the fragment that additionally carries two point mutations, −25 A->U and −34 G->C (counting from the start codon of cheR), which are expected to destabilize the predicted secondary structure upstream of cheR (Figure S3C). Constructs containing 50, 100, and 150 nucleotides, respectively, upstream of cheR start codon are also shown. (E) Temperature-dependent degradation of receptors and CheR. Cells were grown at 27°C or at 37°C to OD600 ≈ 0.48, translation was stopped, and levels of receptors (grey diamonds) and CheR (red circles) were followed over time at the respective growth temperature (27°C, open symbols; 37°C, closed symbols) using immunoblotting. (F) Extent of CheR (red) and receptor (grey) degradation in selected protease knockout strains. Experiments were performed for 1 hour at 37°C as in (E). CheR degradation was assayed in strains that expressed CheR and CheB ~5–6 times above the native level from pVS144 at 0.01% L-arabinose induction. See also Figure S3.

Similar articles

Cited by

References

    1. Alon U, Surette MG, Barkai N, Leibler S. Robustness in bacterial chemotaxis. Nature. 1999;397:168–171. - PubMed
    1. Ames P, Studdert CA, Reiser RH, Parkinson JS. Collaborative signaling by mixed chemoreceptor teams in Escherichia coli. Proc Natl Acad Sci USA. 2002;99:7060–7065. - PMC - PubMed
    1. Andrews BW, Yi TM, Iglesias PA. Optimal noise filtering in the chemotactic response of Escherichia coli. PLoS Comput Biol. 2006;2:e154. - PMC - PubMed
    1. Barkai N, Leibler S. Robustness in simple biochemical networks. Nature. 1997;387:913–917. - PubMed
    1. Berg HC, Brown DA. Chemotaxis in Escherichia coli analysed by three-dimensional tracking. Nature. 1972;239:500–504. - PubMed

Publication types

Substances