. 2011 Jun 15;47(1):12-22.
doi: 10.1016/j.bcmd.2011.03.003. Epub 2011 Apr 15.

Regulation of γ-globin gene expression involves signaling through the p38 MAPK/CREB1 pathway

Affiliations

Regulation of γ-globin gene expression involves signaling through the p38 MAPK/CREB1 pathway

Valya Ramakrishnan et al. Blood Cells Mol Dis. .

Abstract

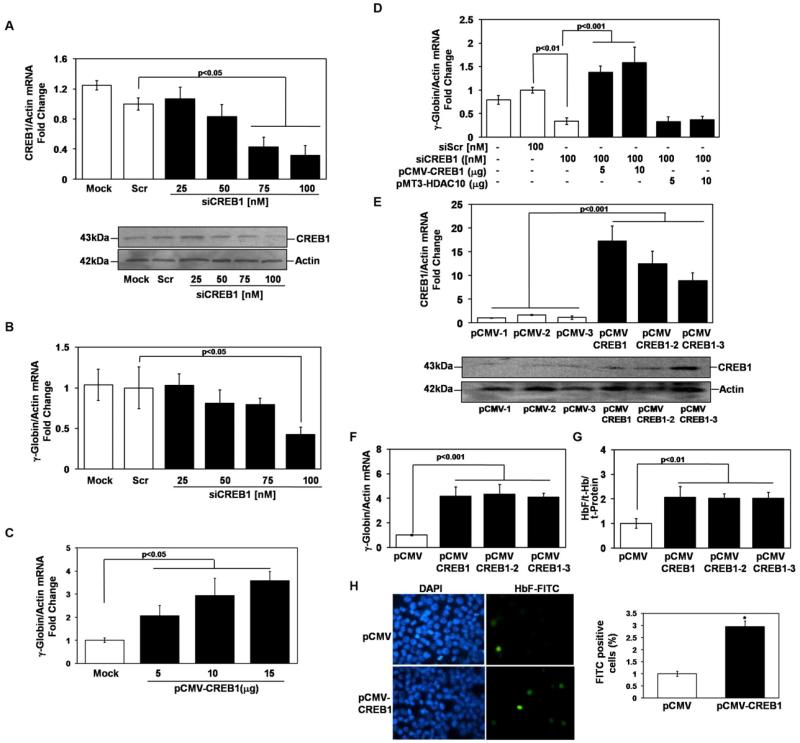
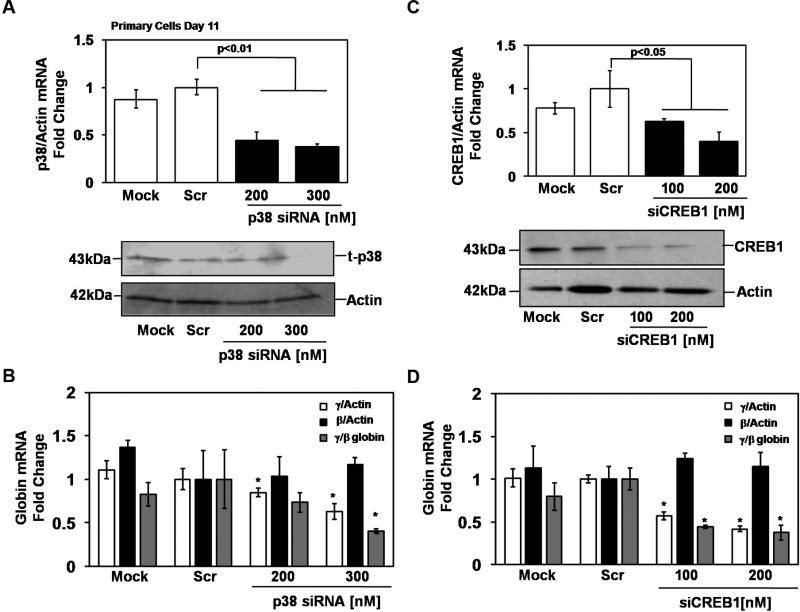
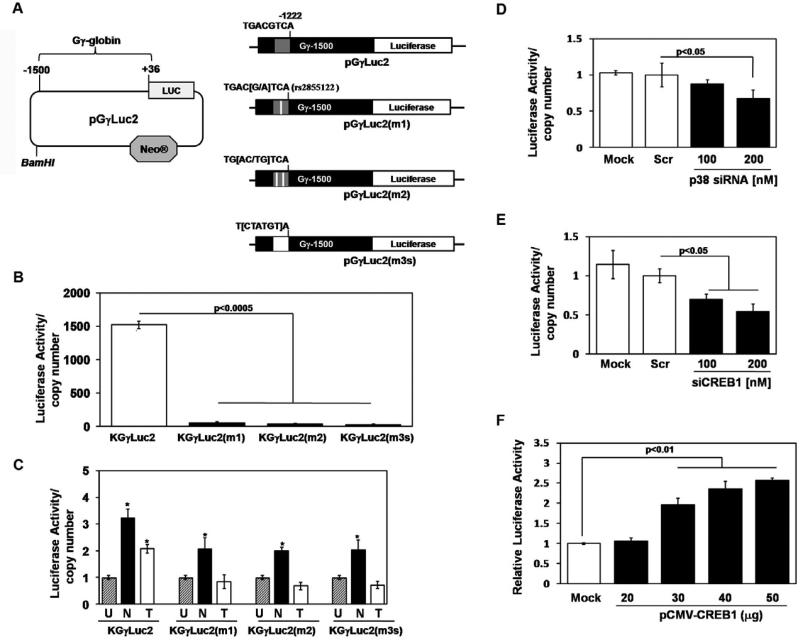
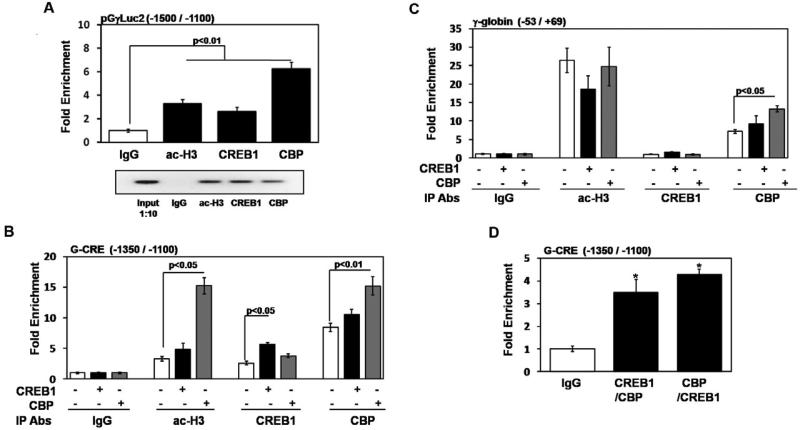
In response to sodium butyrate and trichostatin A treatment in erythroid cells, p38 mitogen activated protein kinase (MAPK) mediates fetal hemoglobin (HbF) induction by activating cAMP response element binding protein 1 (CREB1). To expand on this observation, we completed studies to determine the role of p38 MAPK in steady-state γ-globin regulation. We propose that p38 signaling regulates Gγ-globin transcription during erythroid maturation through its downstream effector CREB1 which binds the Gγ-globin cAMP response element (G-CRE). We demonstrated that a loss of p38 or CREB1 function by siRNA knockdown resulted in target gene silencing. Moreover, gain of p38 or CREB1 function augments γ-globin transcription. These regulatory effects were conserved under physiological conditions tested in primary erythroid cells. When the G-CRE was mutated in a stable chromatin environment Gγ-globin promoter activity was nearly abolished. Furthermore, introduction of mutations in the G-CRE abolished Gγ-globin activation via p38 MAPK/CREB1 signaling. Chromatin immunoprecipitation assays (ChIP) demonstrated that CREB1 and its binding partner CREB binding protein (CBP) co-localize at the G-CRE region. These data support the role of p38 MAPK/CREB1 signaling in Gγ-globin gene transcription under steady-state conditions.


Figures

Fig. 1
Fig. 1
p38 MAPK signaling regulates γ-globin transcription. (A) p38 MAPK mRNA levels were quantified by RT-qPCR analysis using gene specific primers (Table 1); non-targeting scrambled (Scr) siRNA was used as a control. Data were calculated as the mean ± standard error of the mean (SEM), p<0.05 was considered significant. WB analysis was performed using 150μg of total protein and an anti-total p38 (t-p38) antibody, actin was used as a loading control. (B) The effect of p38 MAPK silencing on Gγ-globin and Aγ-globin transcription were quantified using gene specific primers for RT-qPCR analysis. (C) Three stable lines including PC, kMKK3, and kMKK6 were established in K562 cells using the pcDNA, pcDNA3-MKK3 and pcDNA3-MKK6 expression vectors respectively and then clones were isolated (see “Experimental procedures”). WB was performed with 150μg of protein using an anti-HA antibody to confirm gene expression. Levels of phosphophyrolated-p38 (p-p38) and t-p38 were determined by WB. (D) The effect of stable enforced activation of p38 MAPK on γ-globin transcription was determined by RT-qPCR analysis. (E) ELISA was performed to quantify the effect of activating p38 MAPK on HbF expression (see “Experimental procedures”). HbF levels were normalized by total hemoglobin (t-Hb) and total protein (t-Protein). (F) HbF positive cells were visualized by immunostaining with FITC conjugated anti-γ-globin antibody (HbF-FITC); DAPI staining was performed to visualize cell nuclei (magnification ×400). At least 500 DAPI positive cells were counted along with the number of FITC positive cells in the same field and then used to calculate the percentage of HbF positive cells.
Fig. 2
Fig. 2
CREB1 trans-activates γ-globin expression. (A) The effect of siCREB1 treatment on target gene transcription was quantified by RT-qPCR analysis using gene specific primers (Table 1); non-targeting scrambled (Scr) siRNA was used as a control. Data were calculated as the mean ± SEM; p<0.05 was considered significant. WB analysis was performed using 150μg of total protein to confirm CREB1 silencing. (B) The effect of CREB1 silencing on γ-globin transcription was quantified using RT-qPCR. (C) Transient enforced expression of CREB1 was performed in K562 cells for 48hrs. The effect on γglobin transcription was quantified using RT-qPCR (D) Rescue experiments were performed by the addition of siCREB1 alone or combined with pCMV-CREB1 or pMT3-HDAC10 expression vectors (see “Experimental procedures”). For each condition the amount of plasmid added is shown. Represented is the fold change for the expression vectors after subtracting the values obtained from empty vector control transfections. (E) K562 stable lines were established using the pCMV or pCMV-CREB1 expression vectors and then clones were isolated (see “Experimental procedures”). Enforced CREB1 expression was confirmed by RT-qPCR (bar graph) and WB analysis. (F) The effect of stable enforced CREB1 expression on γ-globin transcription was determined by RT-qPCR analysis. (G) ELISA was performed to quantify the effect on HbF levels. (H) HbF positive cells were visualized by immunostaining with FITC conjugated anti-γ-globin antibody and DAPI staining to visualize nuclei.
Fig. 3
Fig. 3
p38 MAPK/CREB1 signaling regulates γ-globin expression in human erythroid progenitors. Peripheral blood mononuclear cells were grown in the two-phase liquid culture system. On day 11, progenitors were transfected with siRNA targeting p38 MAPK or CREB1 using a Nucleofector device transfection system (see “Experimental procedures”). Cells were harvested after 72hrs and RNA and protein were isolated for further analysis. (A) p38 MAPK silencing was confirmed by RT-qPCR and WB analysis. (B) The levels of γ-globin, β-globin and actin gene expression were measured by RT-qPCR. The effect of p38 MAPK silencing on γ-globin and β-globin transcription as well as the ratio of γ/β globin was calculated after the expression of each gene was normalized by actin. (C) In cells treated with siCREB1, target gene silencing was confirmed by RT-qPCR and WB analysis. (D) The effects of CREB1 silencing on γ-globin and β-globin expression and the γ/β ratio were analyzed as described in panel B.
Fig. 4
Fig. 4
CREB1 enforced expression activates γ-globin in erythroid progenitors. Erythroid progenitors grown in the two phase liquid culture system were transfected with pCMV or pCMV-CREB1 on day 11. For all panels, the data shown was obtained from expression vector transfections after subtracting the values obtained from empty vector control transfections. Data were calculated as the mean ± SEM; p<0.05 was considered significant. (A) CREB1 enforced expression was confirmed by RT-qPCR and WB analysis. (B) The effect of enforced CREB1 expression of increasing concentrations of CREB1on γglobin was calculated as a ratio of γ/β mRNA as described in Fig. 3B. (C) HbF positive cells were visualized by immunostaining with FITC conjugated anti-γ-globin antibody (HbF-FITC) after enforced CREB1expression. DAPI staining was performed to visualize nuclei and to determine cell counts (×400 magnification). (D) At least 500 DAPI positive cells were counted along with the number of FITC positive cells in the same field and then used to calculate the percentage of HbF positive cells. (E) ELISA was performed to quantify the effects of enforced CREB1 expression on HbF levels.
Fig. 5
Fig. 5
The G-CRE is required for steady-state promoter activity. (A) Shown are schematics of the reporter plasmids established with the pGL4.17Luc2/neo vector and wild-type or mutant Gγ-globin promoters. (B) Stable lines were established in K562 with reporter plasmids, along with a corresponding empty vector control (see “Experimental procedures”). The luciferase activity of the stable lines was determined by normalizing luciferase activity to total protein and correcting for the copy number of the stable line (luciferase/copy number). Data was calculated as the mean ± SEM; p<0.05 was considered significant. (C) The ability of sodium butyrate (N) or trichostatin A (T) to activate Gγ-promoter activity in the stable lines was tested; cells were treated with each drug for 48hrs and luciferase activity was measured. (D) The effect of p38 MAPK silencing on γ-globin promoter activity was tested in the KGγLuc2 stable line. Cells were treated with p38 MAPK siRNA for 48hrs after which luciferase activity was analyzed. (E) Similar experiments to determine the effects of siCREB1 treatment on γ-globin activity were performed. (F) CREB1 enforced expression studies were performed in the KGγLuc2 line. Protein was harvested after 48hrs and luciferase assay was performed. Shown in the graph is the luciferase activity obtained at the different CREB1 concentrations after subtracting the values obtained for empty vector transfections.
Fig. 6
Fig. 6
The G-CRE mediates activation of the Aγ-globin promoter by CREB1. (A) Shown are schematics of the reporter plasmids established with wild-type Aγ-globin and hybrid promoter with the G-CRE inserted at base -1222 (see “Experimental procedures”). (B) Transient transfection assays were performed in K562 cells. Shown is the luciferase activity of the three reporters after normalization by total protein. Data were calculated as the mean ± SEM; p<0.05 was considered significant. (C) Transient cotransfections of the three constructs with pCMV or pCMV-CREB1 were performed. For each condition the presence (+) or absence (-) of the various reagents is shown.
Fig. 7
Fig. 7
CREB1 and CBP co-localize to the G-CRE region in vivo. (A) ChIP assays were performed in the KGγLuc2 stable line with CREB1, CBP, acetylated histone H3 (ac-H3) and IgG antibodies; chromatin enrichment was normalized to IgG. qPCR analysis was performed using primers unique to the pGγLuc2 construct or endogenous G-CRE regions (Table 1). Data was calculated as the mean ± SEM; p<0.05 was considered significant. Shown in the agarose gel is PCR products of representative samples from each ChIP assay condition; 1:10 diluted input DNA was used as a control. (B) ChIP assays were performed using the KGγLuc2 stable line after CREB1 or CBP enforced expression; untreated cells were used as a control. The antibodies (Abs) used for the different immunoprecipitation (IP) reactions are shown in the graph. For each condition the presence (+) or absence (-) of the various constructs is shown. qPCR analysis was performed using primers specific to the endogenous G-CRE region (Table 1); chromatin enrichment is represented as fold change relative to IgG. (C) For the same chromatin described in Fig.7B, qPCR analysis was also performed using proximal γ-globin promoter primers as a control (Table 1). (D) Sequential ChIP assay was performed in the KGγLuc2 stable line (see “Experimental procedures”). Experiments were performed with CREB1 antibody followed by CBP and vice versa. Enrichment obtained after sequential ChIP was normalized relative to values obtained for IgG.

Similar articles

Cited by

References

    1. Neiman AM. Conservation and reiteration of a kinase cascade. Trends Genet. 1993;9:390–4. - PubMed
    1. Nishida E, Gotoh Y. The MAP kinase cascade is essential for diverse signal transduction pathways. Trends Biochem Sci. 1993;18:128–31. - PubMed
    1. Martin-Blanco E. p38 MAPK signalling cascades: ancient roles and new functions. Bioessays. 2000;22:637–45. - PubMed
    1. Steinbrech DS, Mehrara BJ, Saadeh PB, et al. VEGF expression in an osteoblast-like cell line is regulated by a hypoxia response mechanism. Am J Physiol Cell Physiol. 2000;278:C853–60. - PubMed
    1. Tamura K, Sudo T, Senftleben U, et al. Requirement for p38alpha in erythropoietin expression: a role for stress kinases in erythropoiesis. Cell. 2000;102:221–31. - PubMed

Publication types

MeSH terms

Substances