

Voxelwise gene-wide association study (vGeneWAS): multivariate gene-based association testing in 731 elderly subjects
- PMID: 21497199
- PMCID: PMC3366726
- DOI: 10.1016/j.neuroimage.2011.03.077
Voxelwise gene-wide association study (vGeneWAS): multivariate gene-based association testing in 731 elderly subjects
Abstract
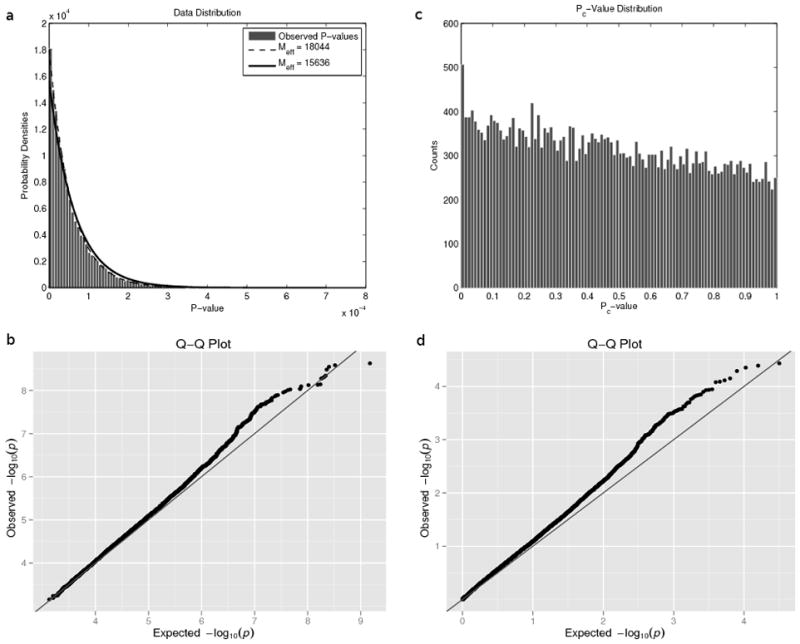
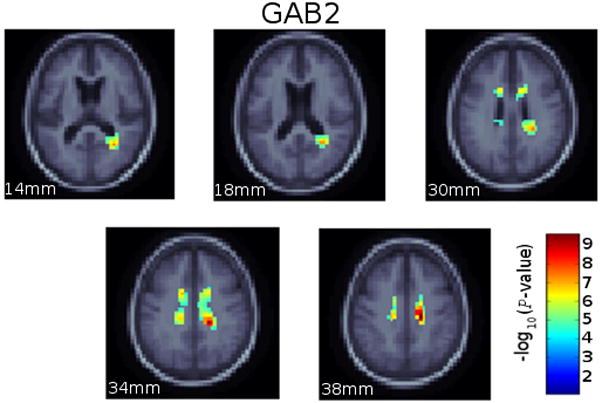
Imaging traits provide a powerful and biologically relevant substrate to examine the influence of genetics on the brain. Interest in genome-wide, brain-wide search for influential genetic variants is growing, but has mainly focused on univariate, SNP-based association tests. Moving to gene-based multivariate statistics, we can test the combined effect of multiple genetic variants in a single test statistic. Multivariate models can reduce the number of statistical tests in gene-wide or genome-wide scans and may discover gene effects undetectable with SNP-based methods. Here we present a gene-based method for associating the joint effect of single nucleotide polymorphisms (SNPs) in 18,044 genes across 31,662 voxels of the whole brain in 731 elderly subjects (mean age: 75.56±6.82SD years; 430 males) from the Alzheimer's Disease Neuroimaging Initiative (ADNI). Structural MRI scans were analyzed using tensor-based morphometry (TBM) to compute 3D maps of regional brain volume differences compared to an average template image based on healthy elderly subjects. Using the voxel-level volume difference values as the phenotype, we selected the most significantly associated gene (out of 18,044) at each voxel across the brain. No genes identified were significant after correction for multiple comparisons, but several known candidates were re-identified, as were other genes highly relevant to brain function. GAB2, which has been previously associated with late-onset AD, was identified as the top gene in this study, suggesting the validity of the approach. This multivariate, gene-based voxelwise association study offers a novel framework to detect genetic influences on the brain.
Copyright © 2011 Elsevier Inc. All rights reserved.
Figures


Similar articles
-
Increasing power for voxel-wise genome-wide association studies: the random field theory, least square kernel machines and fast permutation procedures.Neuroimage. 2012 Nov 1;63(2):858-73. doi: 10.1016/j.neuroimage.2012.07.012. Epub 2012 Jul 16. Neuroimage. 2012. PMID: 22800732 Free PMC article.
-
Voxelwise genome-wide association study (vGWAS).Neuroimage. 2010 Nov 15;53(3):1160-74. doi: 10.1016/j.neuroimage.2010.02.032. Epub 2010 Feb 17. Neuroimage. 2010. PMID: 20171287 Free PMC article.
-
Tensor-based morphometry as a neuroimaging biomarker for Alzheimer's disease: an MRI study of 676 AD, MCI, and normal subjects.Neuroimage. 2008 Nov 15;43(3):458-69. doi: 10.1016/j.neuroimage.2008.07.013. Epub 2008 Jul 22. Neuroimage. 2008. PMID: 18691658 Free PMC article.
-
Strategies for multivariate analyses of imaging genetics study in Alzheimer's disease.Neurosci Lett. 2021 Sep 25;762:136147. doi: 10.1016/j.neulet.2021.136147. Epub 2021 Jul 29. Neurosci Lett. 2021. PMID: 34332030 Review.
-
Imaging genomics.Curr Opin Neurol. 2010 Aug;23(4):368-73. doi: 10.1097/WCO.0b013e32833b764c. Curr Opin Neurol. 2010. PMID: 20581684 Free PMC article. Review.
Cited by
-
Genome-wide association studies of brain imaging data via weighted distance correlation.Bioinformatics. 2020 Dec 8;36(19):4942-4950. doi: 10.1093/bioinformatics/btaa612. Bioinformatics. 2020. PMID: 32619001 Free PMC article.
-
The Alzheimer's Disease Neuroimaging Initiative: a review of papers published since its inception.Alzheimers Dement. 2013 Sep;9(5):e111-94. doi: 10.1016/j.jalz.2013.05.1769. Epub 2013 Aug 7. Alzheimers Dement. 2013. PMID: 23932184 Free PMC article. Review.
-
Sparse canonical correlation analysis relates network-level atrophy to multivariate cognitive measures in a neurodegenerative population.Neuroimage. 2014 Jan 1;84:698-711. doi: 10.1016/j.neuroimage.2013.09.048. Epub 2013 Oct 2. Neuroimage. 2014. PMID: 24096125 Free PMC article.
-
Accelerating Heritability, Genetic Correlation, and Genome-Wide Association Imaging Genetic Analyses in Complex Pedigrees.Hum Brain Mapp. 2024 Dec 1;45(17):e70044. doi: 10.1002/hbm.70044. Hum Brain Mapp. 2024. PMID: 39593222 Free PMC article.
-
Genetics and brain morphology.Neuropsychol Rev. 2015 Mar;25(1):63-96. doi: 10.1007/s11065-015-9281-1. Epub 2015 Mar 14. Neuropsychol Rev. 2015. PMID: 25773500
References
-
- Altshuler D, Brooks LD, Chakravarti A, Collins FS, Daly MJ, Donnelly P, Gibbs RA, Belmont JW, Boudreau A, Leal SM, Hardenbol P, Pasternak S, Wheeler DA, Willis TD, Yu FL, Yang HM, Zeng CQ, Gao Y, Hu HR, Hu WT, Li CH, Lin W, Liu SQ, Pan H, Tang XL, Wang J, Wang W, Yu J, Zhang B, Zhang QR, Zhao HB, Zhao H, Zhou J, Gabriel SB, Barry R, Blumenstiel B, Camargo A, Defelice M, Faggart M, Goyette M, Gupta S, Moore J, Nguyen H, Onofrio RC, Parkin M, Roy J, Stahl E, Winchester E, Ziaugra L, Shen Y, Yao ZJ, Huang W, Chu X, He YG, Jin L, Liu YF, Shen YY, Sun WW, Wang HF, Wang Y, Wang Y, Wang Y, Xiong XY, Xu L, Waye MMY, Tsui SKW, Xue H, Wong JTF, Galver ILM, Fan JB, Murray SS, Oliphant AR, Chee MS, Montpetit A, Chagnon F, Ferretti V, Leboeuf M, Olivier JF, Phillips MS, Roumy S, Sallee C, Verner A, Hudson TJ, Frazer KA, Ballinger DG, Cox DR, Hinds DA, Stuve LL, Kwok PY, Cai DM, Koboldt DC, Miller RD, Pawlikowska L, Taillon-Miller P, Xiao M, Tsui LC, Mak W, Sham PC, Song YQ, Tam PKH, Nakamura Y, Kawaguchi T, Kitamoto T, Morizono T, Nagashima A, Ohnishi Y, Sekine A, Tanaka T, Tsunoda T, Deloukas P, Bird CP, Delgado M, Dermitzakis ET, Gwilliam R, Hunt S, Morrison J, Powell D, Stranger BE, Whittaker P, Bentley DR, Daly MJ, de Bakker PIW, Barrett J, Fry B, Maller J, McCarroll S, Patterson N, Pe’er I, Purcell S, Richter DJ, Sabeti P, Saxena R, Schaffner SF, Varilly P, Stein LD, Krishnan L, Smith AV, Thorisson GA, Chen PE, Cutler DJ, Kashuk CS, Lin S, Abecasis GR, Guan WH, Munro HM, Qin ZHS, Thomas DJ, McVean G, Bottolo L, Eyheramendy S, Freeman C, Marchini J, Myers S, Spencer C, Stephens M, Cardon LR, Clarke G, Evans DM, Morris AP, Weir BS, Tsunoda T, Mullikin JC, Sherry ST, Feolo M, Zhang HC, Zeng CQ, Zhao H, Matsuda I, Fukushima Y, Macer DR, Suda E, Rotimi CN, Adebamowo CA, Ajayi I, Aniagwu T, Marshall PA, Nkwodimmah C, Royal CDM, Leppert MF, Dixon M, Peiffer A, Qiu RZ, Kent A, Kato K, Niikawa N, Adewole IF, Knoppers BM, Foster MW, Clayton EW, Muzny D, Nazareth L, Sodergren E, Weinstock GM, Wheeler DA, Yakub I, Gabriel SB, Richter DJ, Ziaugra L, Birren BW, Wilson RK, Fulton LL, Rogers J, Burton J, Carter NP, Clee CM, Griffiths M, Jones MC, McLay K, Plumb RW, Ross MT, Sims SK, Willey DL, Chen Z, Han H, Kang L, Godbout M, Wallenburg JC, Archeveque PL, Bellemare G, Saeki K, Wang HG, An DC, Fu HB, Li Q, Wang Z, Wang RW, Holden AL, Brooks LD, McEwen JE, Bird CR, Guyer MS, Nailer PJ, Wang VO, Peterson JL, Shi M, Spiegel J, Sung LM, Witonsky J, Zacharia LF, Kennedy K, Jamieson R, Stewart J, Consortium IH. A haplotype map of the human genome. Nature. 2005;437:1299–1320. - PMC - PubMed
-
- Bagnoli S, Nacmias B, Tedde A, Guarnieri BM, Cellini E, Petruzzi C, Bartoli A, Ortenzi L, Sorbi S. Brain-derived neurotrophic factor genetic variants are not susceptibility factors to Alzheimer’s disease in Italy. Ann Neurol. 2004;55:447–448. - PubMed
-
- Benjamini Y, Hochberg Y. Controlling the False Discovery Rate - a Practical and Powerful Approach to Multiple Testing. Journal of the Royal Statistical Society Series B-Methodological. 1995;57:289–300.
-
- Benjamini Y, Yekutieli D. The control of the false discovery rate in multiple testing under dependency. Annals of Statistics. 2001;29:1165–1188.
Publication types
MeSH terms
Substances
Grants and funding
LinkOut - more resources
Full Text Sources
Medical
