

Homeostastic and non-homeostatic functions of melanocortin-3 receptors in the control of energy balance and metabolism
- PMID: 21497617
- PMCID: PMC3139773
- DOI: 10.1016/j.physbeh.2011.04.007
Homeostastic and non-homeostatic functions of melanocortin-3 receptors in the control of energy balance and metabolism
Abstract
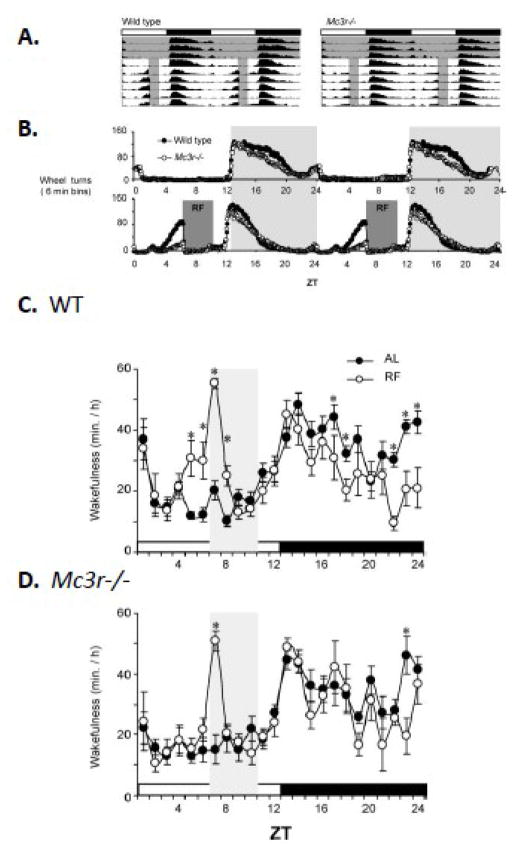
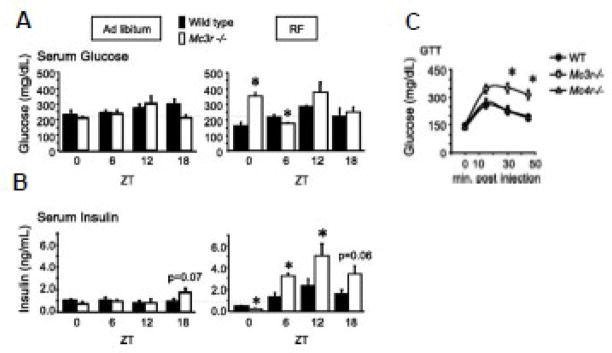
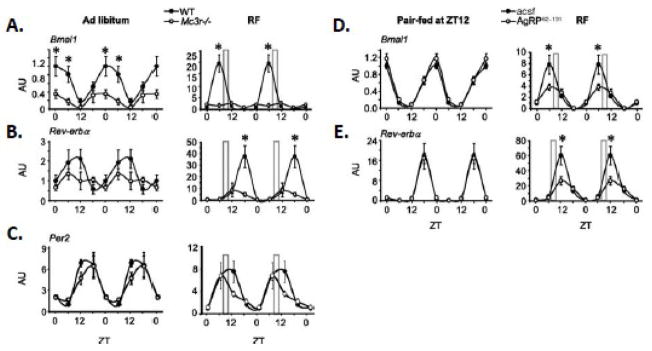
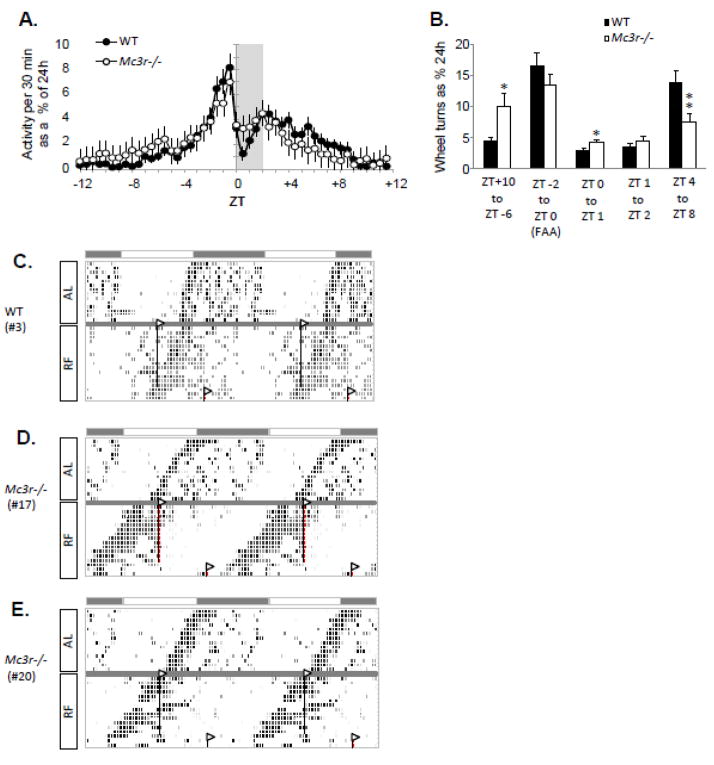
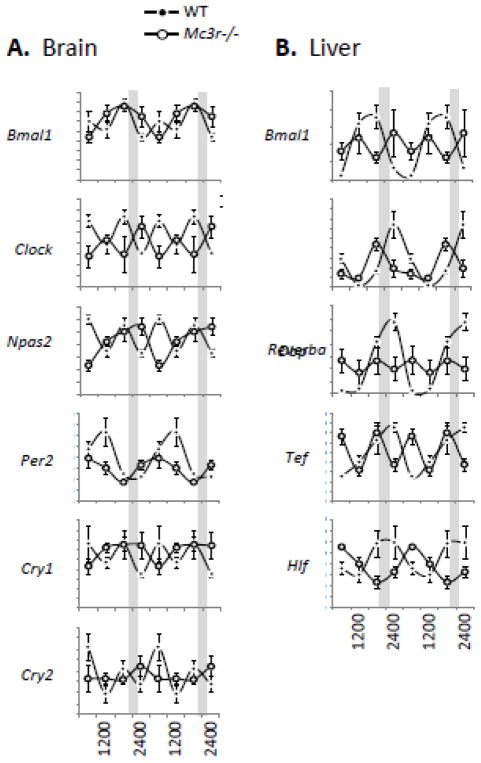
The central nervous melanocortin system is a neural network linking nutrient-sensing systems with hypothalamic, limbic and hindbrain neurons regulating behavior and metabolic homeostasis. Primary melanocortin neurons releasing melanocortin receptor ligands residing in the hypothalamic arcuate nucleus are regulated by nutrient-sensing and metabolic signals. A smaller group of primary neurons releasing melanocortin agonists in the nucleus tractus solitarius in the brainstem are also regulated by signals of metabolic state. Two melanocortin receptors regulate energy homeostasis. Melanocortin-4 receptors regulate satiety and autonomic outputs controlling peripheral metabolism. The functions of melanocortin-3 receptors (MC3R) expressed in hypothalamic and limbic structures are less clear. Here we discuss published data and preliminary observations from our laboratory suggesting that neural MC3R regulate inputs into systems governing the synchronization of rhythms in behavior and metabolism with nutrient intake. Mice subjected to a restricted feeding protocol, where a limited number of calories are presented at a 24h interval, rapidly exhibit bouts of increased wakefulness and activity which anticipate food presentation. The full expression of these responses is dependent on MC3R. Moreover, MC3R knockout mice are unique in exhibiting a dissociation of weight loss from improved glucose homeostasis when subject to a restricted feeding protocol. While mice lacking MC3R fed ad libitum exhibit normal to moderate hyperinsulinemia, when subjected to a restricted protocol they develop hyperglycemia, glucose intolerance, and dyslipidemia. Collectively, our data suggest that the central nervous melanocortin system is a point convergence in the control of energy balance and the expression of rhythms anticipating nutrient intake.
Published by Elsevier Inc.
Figures
Similar articles
-
Melanocortin-3 receptors are involved in adaptation to restricted feeding.Genes Brain Behav. 2012 Apr;11(3):291-302. doi: 10.1111/j.1601-183X.2012.00766.x. Epub 2012 Feb 6. Genes Brain Behav. 2012. PMID: 22353545 Free PMC article.
-
Unravelling the mysterious roles of melanocortin-3 receptors in metabolic homeostasis and obesity using mouse genetics.Int J Obes Suppl. 2014 Jul;4(Suppl 1):S37-44. doi: 10.1038/ijosup.2014.10. Epub 2014 Jul 8. Int J Obes Suppl. 2014. PMID: 27152165 Free PMC article. Review.
-
The role of melanocortin neuronal pathways in circadian biology: a new homeostatic output involving melanocortin-3 receptors?Obes Rev. 2009 Nov;10 Suppl 2(Suppl 2):14-24. doi: 10.1111/j.1467-789X.2009.00662.x. Obes Rev. 2009. PMID: 19849798 Free PMC article. Review.
-
Genetic dissection of the functions of the melanocortin-3 receptor, a seven-transmembrane G-protein-coupled receptor, suggests roles for central and peripheral receptors in energy homeostasis.J Biol Chem. 2011 Nov 25;286(47):40771-81. doi: 10.1074/jbc.M111.278374. Epub 2011 Oct 7. J Biol Chem. 2011. PMID: 21984834 Free PMC article.
-
Melanocortin-3 receptors and metabolic homeostasis.Prog Mol Biol Transl Sci. 2013;114:109-46. doi: 10.1016/B978-0-12-386933-3.00004-2. Prog Mol Biol Transl Sci. 2013. PMID: 23317784 Free PMC article. Review.
Cited by
-
Melanocortin-3 receptors are involved in adaptation to restricted feeding.Genes Brain Behav. 2012 Apr;11(3):291-302. doi: 10.1111/j.1601-183X.2012.00766.x. Epub 2012 Feb 6. Genes Brain Behav. 2012. PMID: 22353545 Free PMC article.
-
Unravelling the mysterious roles of melanocortin-3 receptors in metabolic homeostasis and obesity using mouse genetics.Int J Obes Suppl. 2014 Jul;4(Suppl 1):S37-44. doi: 10.1038/ijosup.2014.10. Epub 2014 Jul 8. Int J Obes Suppl. 2014. PMID: 27152165 Free PMC article. Review.
-
The Melanocortin System behind the Dysfunctional Eating Behaviors.Nutrients. 2020 Nov 14;12(11):3502. doi: 10.3390/nu12113502. Nutrients. 2020. PMID: 33202557 Free PMC article. Review.
-
Neural melanocortin receptors in obesity and related metabolic disorders.Biochim Biophys Acta. 2014 Mar;1842(3):482-94. doi: 10.1016/j.bbadis.2013.05.004. Epub 2013 May 13. Biochim Biophys Acta. 2014. PMID: 23680515 Free PMC article. Review.
-
Molecular and cellular regulation of thermogenic fat.Front Endocrinol (Lausanne). 2023 Jul 3;14:1215772. doi: 10.3389/fendo.2023.1215772. eCollection 2023. Front Endocrinol (Lausanne). 2023. PMID: 37465124 Free PMC article. Review.
References
-
- Cannon WB. Organization for physiological homeostasis. Physiol Rev. 1929;9:399–431.
-
- Lam CK, Chari M, Lam TK. CNS regulation of glucose homeostasis. Physiology (Bethesda) 2009;24:159–70. - PubMed
-
- Reaven GM. Why Syndrome X? From Harold Himsworth to the insulin resistance syndrome. Cell Metab. 2005;1:9–14. - PubMed
Publication types
MeSH terms
Substances
Grants and funding
LinkOut - more resources
Full Text Sources
