. 2011 Apr 19;20(4):497-510.
doi: 10.1016/j.devcel.2011.03.010.

A genome-wide screen reveals a role for microRNA-1 in modulating cardiac cell polarity

Affiliations

A genome-wide screen reveals a role for microRNA-1 in modulating cardiac cell polarity

Isabelle N King et al. Dev Cell. .

Abstract

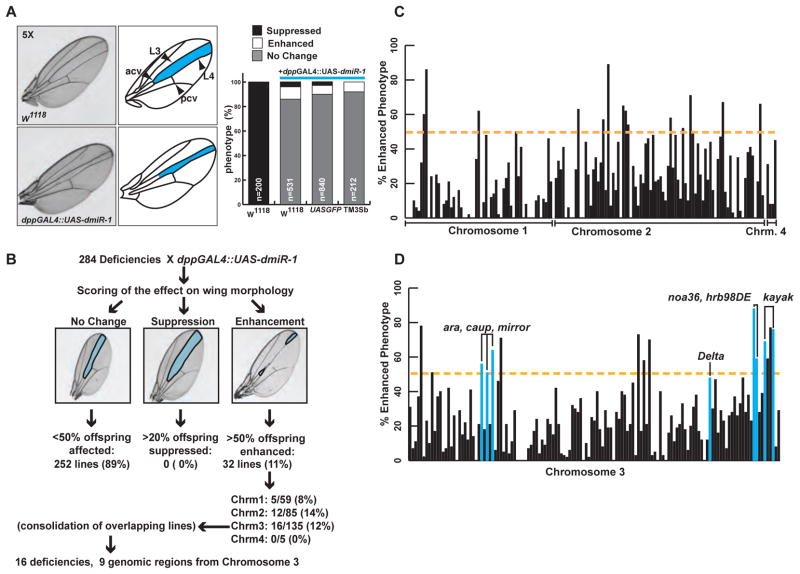
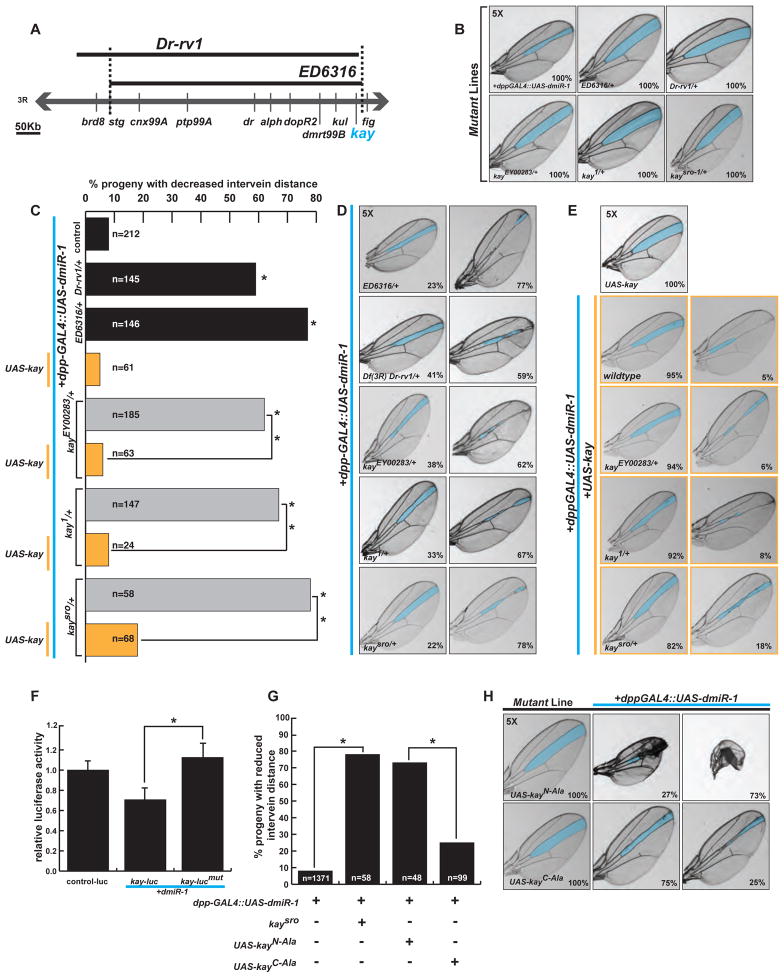
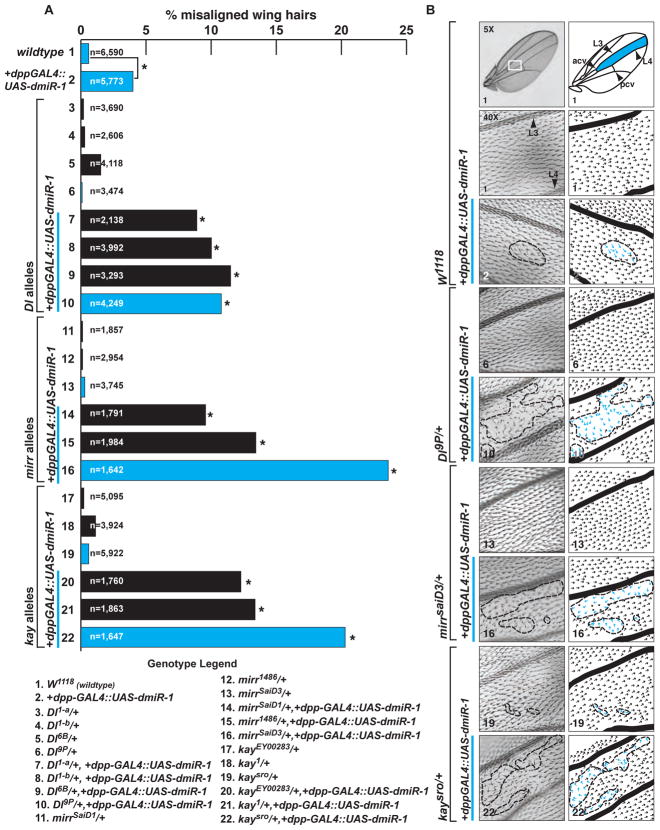
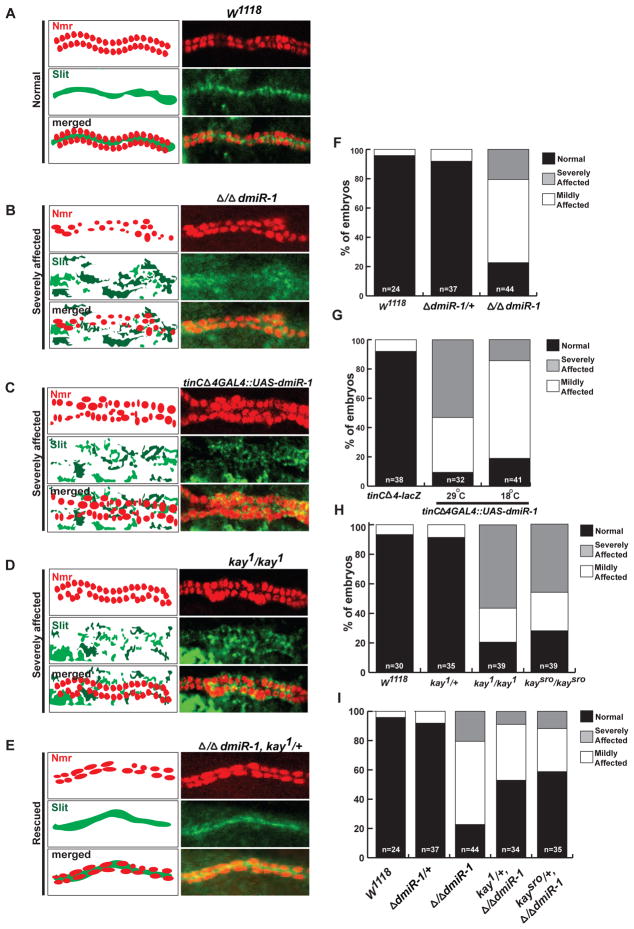
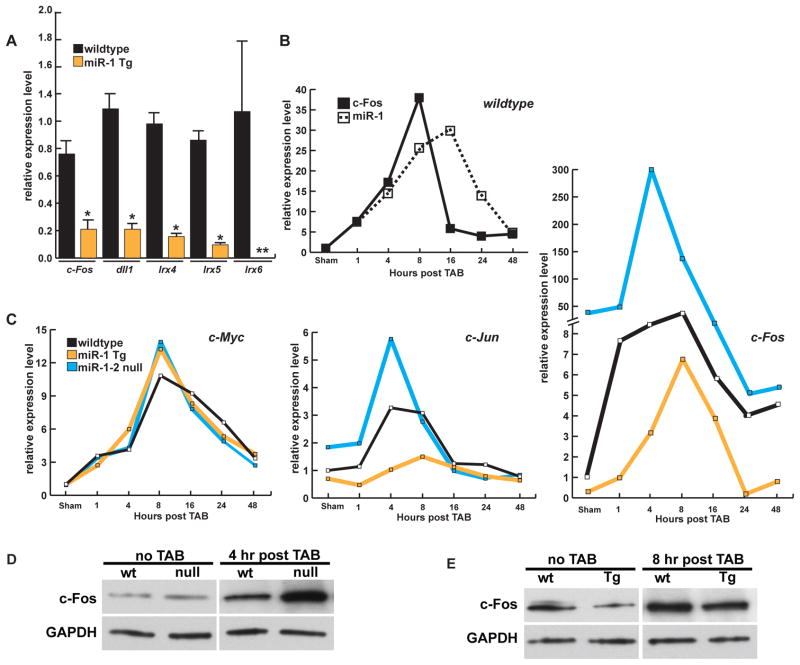
Many molecular pathways involved in heart disease have their roots in evolutionarily ancient developmental programs that depend critically on gene dosage and timing. MicroRNAs (miRNAs) modulate gene dosage posttranscriptionally, and among these, the muscle-specific miR-1 is particularly important for developing and maintaining somatic/skeletal and cardiac muscle. To identify pathways regulated by miR-1, we performed a forward genetic screen in Drosophila using wing-vein patterning as a biological assay. We identified several unexpected genes that genetically interacted with dmiR-1, one of which was kayak, encodes a developmentally regulated transcription factor. Additional studies directed at this genetic relationship revealed a previously unappreciated function of dmiR-1 in regulating the polarity of cardiac progenitor cells. The mammalian ortholog of kayak, c-Fos, was dysregulated in hearts of gain- or loss-of-function miR-1 mutant mice in a stress-dependent manner. These findings illustrate the power of Drosophila-based screens to find points of intersection between miRNAs and conserved pathways in mammals.


Figures

Figure 1
Figure 1. Misexpression of dmiR-1 in the Drosophila wing results in a distinctive phenotype and identifies genetic partners of dmiR-1
(A) Upper left: image of a wildtype wing, with pertinent anatomical structures labeled to the right. L3: long vein number 3, L4: long vein number 4, acv: anterior cross vein, pcv: posterior cross vein. Area highlighted in blue: area of expression of the wing disc specific decapentaplegic (dpp) enhancer. Lower left: image of wing from a dpp-GAL4::UAS-dmiR-1 mutant fly. Note narrowing of the L3/L4 inter-vein distance. Left: Incidence of enhancement, and suppression of the wing phenotype seen in dpp-GAL4::UAS-dmiR-1 mutant flies when mated with control fly lines. W1118: wildtype. The lines UAS-GFP and dpp-GAL4::UAS-dmiR-1/TM3Sb (TM3Sb) served as controls. TM3Sb: balancer. (B) Summary of results from the forward genetic screen. (C) Distribution of percentage affected offspring from each deficiency, organized by chromosome (1, 2, and 4). Yellow dashed line: point at which 50% of progeny were affected. Those deficiencies that met or exceeded this level were considered strongly positive (p<0.0001). (D) Distribution of percentage affected offspring from each deficiency, organized by position on chromosome 3, going left to right. Blue bars: deficiencies containing specific genes (labeled) that enhanced the wing phenotype. (See also Supplementary Table 1)
Figure 2
Figure 2. Validation of the dmiR-1 enhancer/suppressor genetic screen
(A) Schematic of the deficiency ED5942 spanning delta. (B) Percentages of affected offspring when specific deficiencies and alleles of delta were mated to the dpp-GAL4::UAS-dmiR-1 line. Dl1, Dl9P, Dl6B are loss of function alleles. Yellow bars depict rescue of enhancement as shown in the center panels of (C). * p-value <0.001. (C) Panels of representative fly wings with the L3/L4 area highlighted in blue. Control parental mutant lines (ED5942, Dl6B and UAS-delta) shown to the left, with representative wings of pertinent offspring when crossed with the dpp-GAL4::UAS-dmiR-1 line. Wings scored as “no change from dpp-GAL4::UAS-dmiR-1” (center) or “enhanced” (right), with percentages noted in bottom right corner. Yellow edged images: (top) UAS-delta, Dl6B, dpp-GAL4::UAS-dmiR-1 representative fly wings displaying rescue of the phenotype, and the control UAS-delta, dpp-GAL4::UAS-dmiR-1, representative fly wings (bottom). (D) Schematic of deficiencies containing the Iroquois locus: araucan (ara), caupolican (caup), mirror (mirr). Blue lines: chromosomal location of deficiencies that enhance the dpp-GAL4::UAS-dmiR-1 phenotype in ≥ 50% of progeny. (E) Percentages of affected offspring when specific deficiencies (as in D), and loss of function alleles of the Iroquois locus (araMB04926, araMB04323, caupMB00278, caupBG01626, mirr1825, mirrSaiD3, mirrSaiD1, mirr1486) were mated to the dpp-GAL4::UAS-dmiR-1 line. * p-value <0.001. (F) Control parental mutant lines (BSC10, araMB04323, caupBG01626 and mirr1486) shown to the left, with representative wings of pertinent offspring when crossed with the dpp-GAL4::UAS-dmiR-1 line (as in E). Wings scored as “no change” (center) or “enhanced” (right), with percentages noted in bottom right corner. (See also Supplementary Figure1&2)
Figure 3
Figure 3. Kayak genetically interacts with dmiR-1
(A) Schematic of the deficiencies Df(3R) Dr-rv-1 and Df(3R)ED6316 spanning kayak. (B) Panels of representative parental mutant fly wings with the L3/L4 area highlighted in blue. Note normal L3/L4 inter-vein distance. (C) Percentages of affected offspring when specific deficiencies and mutant alleles of kay were mated to the dpp-GAL4::UAS-dmiR-1 line. Yellow bars depict rescue of phenotypic enhancement with expression of kay (UAS-kay) as shown in D. * p-value <0.001. (D) Representative wings of pertinent offspring when Df(3R) Dr-rv-1 and Df(3R)ED6316, and the loss of function kay alleles (kayEY00283, kay1, kaysro) were crossed with the dpp-GAL4::UAS-dmiR-1 line. Wings scored as “no change” (left) or “enhanced” (right), with percentages noted in bottom right corner. (E) Images of representative wings from a genetic rescue experiment. Top: control wing from a UAS-kay fly. Lower rows: Matings between UAS-kay, dpp-GAL4::UAS-dmiR-1 flies and flies harboring heterozygous mutant alleles of kay (kayEY01644, kay1, kaysro). Wings were scored as “no change” (left) or “enhanced” (right), with percentages noted in bottom right corner. (F) Relative luciferase activity with or without the 3′UTR of kay which is inserted into the 3′UTR of a constitutively active luciferase vector in the presence or absence of dmiR-1. Kay-lucmut: luciferase reporter with the two putative dmiR-1 binding sites mutated as shown in Figure S3B. *p<0.05. Error bars are represented as standard error of the mean. (G) Percentage of affected offspring, comparing kaysro mutants to mutants containing amino- and carboxy-terminal substitutions of serine and threonine residues to alanine. * p-value <0.001. (H) Photographs of representative wings for data in (G). (See also Supplementary Figure 3)
Figure 4
Figure 4. Enhancement of dmiR-1 PCP defects by haploinsufficiency of delta, mirror and kayak
(A) Graphic of percentage of misaligned wing hairs with n= number of hairs counted, representing a minimum number of five individual animals. Genotypes detailed below. * p<0.001. Blue bars denote genotypes represented by photographs in (B). (B) Photographs of representative adult fly wings of noted genotypes with schematic of hair alignment (right). Top: W1118 (wildtype) wing with pertinent anatomical structures noted to right. White box: low magnification view of location where hair alignment was determined. Areas with misaligned wing hairs are outlined in a dashed line, with individual hairs of normal proximal-distal orientation (black) or misoriented (blue) indicated. Genotype noted in bottom left corner. (See also Supplementary Figure 4 and 5)
Figure 5
Figure 5. dmiR-1 influences cell polarity in the Drosophila heart
(A) Schematic of the expression pattern for Neuromancer (Nmr, red) and Slit (green) in wildtype (W1118) Drosophila hearts (left). Confocal images showing Nmr and Slit localization within the fly heart in wildtype (W1118) stage 16 embryos (right). (B) Schematic (left) and confocal (right) images of homozygous-null dmiR-1 stage 16 embryos, with Nmr and Slit expression in red and green, respectively. (C) Schematic (left) and confocal (right) images of tinC Δ4GAL4::UASdmiR-1 stage 16 embryos, with Nmr and Slit expression in red and green, respectively. (D) Schematic (left) and confocal (right) images of homozygous mutant kay1 stage 16 embryos, with Nmr and Slit expression in red and green, respectively. (E) Schematic (left) and confocal (right) images of homozygous-null dmiR-1, kay1/+ stage 16 embryos, with Nmr and Slit expression in red and green, respectively. (F) Quantification of panel (B) with normal (black), mildly (white), or severely (grey) affected embryos, according to genotype. Scoring was based on the degree of misalignment of the cardioblasts and diffuse expression of Slit. (G) Quantification of panel (C) with normal (black), mildly (white), or severely (grey) affected embryos, according to genotype and temperature. (H) Quantification of panel (D) with normal (black), mildly (white), or severely (grey) affected embryos, according to genotype. (I) Quantification of panel (E) with normal (black), mildly (white), or severely (grey) affected embryos, according to genotype. (See also Supplementary Figure 6 and 7)
Figure 6
Figure 6. miR-1-2 limits stress-induced activation of the kay orthologue, c-Fos, in mouse hearts
(A) Quantification of mRNA levels for mouse homologues of genes found to have a genetic interaction with dmiR-1 in wildtype (black) or α-MHC-miR-1 transgenic (Tg) mice (yellow). *p=<0.05. dll1:delta-like-1, Irx4,5,6: Iroquois family 4,5,6. All values normalized to GAPDH levels. ** not detectable. n=4 animals for each time point. Error bars are represented as standard error of the mean. (B) Time course of c-Fos or miR-1 expression after thoracic aortic banding (TAB) by qPCR in wildtype mice. (C) Time course of c-myc (left), c-Jun (middle) and c-Fos (right) expression as determined by qPCR analysis after TAB. Wildtype animals (black), α-MHC-miR-1 transgenic mice (yellow) and miR-1-2 null (blue) mice are indicated. (D–E) Western blots of mouse hearts at time points of maximal c-Fos induction in miR-1-2 null (ko) (D) or α-MHC-miR-1 transgenic (Tg) animals (E) after TAB.

References

    1. Bao ZZ, Bruneau BG, Seidman JG, Seidman CE, Cepko CL. Regulation of chamber-specific gene expression in the developing heart by Irx4. Science. 1999;283:1161–1164. - PubMed
    1. Bartel DP. MicroRNAs: target recognition and regulatory functions. Cell. 2009;136:215–233. - PMC - PubMed
    1. Bernstein E, Kim SY, Carmell MA, Murchison EP, Alcorn H, Li MZ, Mills AA, Elledge SJ, Anderson KV, Hannon GJ. Dicer is essential for mouse development. Nat Genet. 2003;35:215–217. - PubMed
    1. Boutros M, Paricio N, Strutt DI, Mlodzik M. Dishevelled activates JNK and discriminates between JNK pathways in planar polarity and wingless signaling. Cell. 1998;94:109–118. - PubMed
    1. Brand AH, Perrimon N. Targeted gene expression as a means of altering cell fates and generating dominant phenotypes. Development. 1993;118:401–415. - PubMed

Publication types

LinkOut - more resources