. 2011 Jun 10;286(23):20466-77.
doi: 10.1074/jbc.M111.219071. Epub 2011 Apr 15.

Multiple transmembrane binding sites for p-trifluoromethyldiazirinyl-etomidate, a photoreactive Torpedo nicotinic acetylcholine receptor allosteric inhibitor

Affiliations

Multiple transmembrane binding sites for p-trifluoromethyldiazirinyl-etomidate, a photoreactive Torpedo nicotinic acetylcholine receptor allosteric inhibitor

Ayman K Hamouda et al. J Biol Chem. .

Abstract

Photoreactive derivatives of the general anesthetic etomidate have been developed to identify their binding sites in γ-aminobutyric acid, type A and nicotinic acetylcholine receptors. One such drug, [(3)H]TDBzl-etomidate (4-[3-(trifluoromethyl)-3H-diazirin-3-yl]benzyl-[(3)H]1-(1-phenylethyl)-1H-imidazole-5-carboxylate), acts as a positive allosteric potentiator of Torpedo nACh receptor (nAChR) and binds to a novel site in the transmembrane domain at the γ-α subunit interface. To extend our understanding of the locations of allosteric modulator binding sites in the nAChR, we now characterize the interactions of a second aryl diazirine etomidate derivative, TFD-etomidate (ethyl-1-(1-(4-(3-trifluoromethyl)-3H-diazirin-3-yl)phenylethyl)-1H-imidazole-5-carboxylate). TFD-etomidate inhibited acetylcholine-induced currents with an IC(50) = 4 μM, whereas it inhibited the binding of [(3)H]phencyclidine to the Torpedo nAChR ion channel in the resting and desensitized states with IC(50) values of 2.5 and 0.7 mm, respectively. Similar to [(3)H]TDBzl-etomidate, [(3)H]TFD-etomidate bound to a site at the γ-α subunit interface, photolabeling αM2-10 (αSer-252) and γMet-295 and γMet-299 within γM3, and to a site in the ion channel, photolabeling amino acids within each subunit M2 helix that line the lumen of the ion channel. In addition, [(3)H]TFD-etomidate photolabeled in an agonist-dependent manner amino acids within the δ subunit M2-M3 loop (δIle-288) and the δ subunit transmembrane helix bundle (δPhe-232 and δCys-236 within δM1). The fact that TFD-etomidate does not compete with ion channel blockers at concentrations that inhibit acetylcholine responses indicates that binding to sites at the γ-α subunit interface and/or within δ subunit helix bundle mediates the TFD-etomidate inhibitory effect. These results also suggest that the γ-α subunit interface is a binding site for Torpedo nAChR negative allosteric modulators (TFD-etomidate) and for positive modulators (TDBzl-etomidate).


Figures

FIGURE 1.
FIGURE 1.
Structures of etomidate and its photoreactive derivatives.
FIGURE 2.
FIGURE 2.
A, TFD-etomidate (●) and etomidate (○) inhibition of Torpedo nAChR responses are shown. Oocytes injected with wild type Torpedo nAChR mRNA at a ratio of 2α:1β:1γ:1δ were voltage-clamped at −50 mV, and currents elicited by 10 μm ACh (∼EC10) were recorded in the absence or presence of increasing concentrations of TFD-etomidate (●) or etomidate (○). The graphs present data from two oocytes for each drug, which was tested at least three times at each concentration. Currents were normalized to the current elicited by 10 μm ACh alone, and the data were fitted to a logistic equation {F = 1 − xn/(IC50n +xn} using OriginPro 6.1. For TFD-etomidate, IC50 = 4.1 ± 0.5 μm, n = 1.1 ± 0.07. For etomidate, IC50 = 21 ± 3 μm, n = 0.9 ± 0.07. B, shown is TFD-etomidate modulation of the equilibrium binding of [3H]ACh (○), [3H]tetracaine (◊), and [3H]PCP (+Carb (■); −Carb, (□)) to the Torpedo nAChR. Binding was determined by centrifugation, and for each experiment the data were normalized to the specific binding in the absence of competitor. Total binding and nonspecific binding of [3H]ACh were 10,260 ± 90 and 170 ± 20 cpm, respectively; for [3H]tetracaine, 30,470 ± 460 and 4310 ± 60 cpm; for [3H]PCP (+Carb), 7680 ± 40 and 504 ± 11 cpm; for [3H]PCP (−Carb), 2540 ± 20 and 620 ± 15 cpm. Inhibition of [3H]PCP binding to Torpedo nAChR in the desensitized state by etomidate (▴, IC50, 0.16 ± 0.03 mm) is shown for comparison. At 300 μm TFD-etomidate, the methanol concentration was 1% (v/v), which inhibited [3H]tetracaine binding by 10% and enhanced [3H]ACh binding by 12%.
FIGURE 3.
FIGURE 3.
Photoincorporation of [3H]TFD-etomidate into Torpedo nAChR. Torpedo nAChR-rich membranes at 2 mg of protein/ml (150 pmol of ACh binding sites/lane) were photolabeled with 1 μm [3H]TFD-etomidate in the absence (lane 2) or presence of nAChR ligands (lanes 3, 100 μm tetracaine; lane 4, 100 μm proadifen; lane 5, 1 mm Carb; lane 6, 1 mm Carb and 100 μm proadifen; lane 7, 1 mm Carb and 100 μm PCP; lane 8, 1 mm Carb and 100 μm meproadifen). Photolabeling was carried out in duplicate, and membrane polypeptides were resolved on two parallel SDS-PAGE gels that were stained with Coomassie Blue stain (lane 1). Top panel, one gel was processed for fluorography (lanes 2–8, 2 weeks of exposure). The electrophoretic mobilities of the nAChR α, β, γ, and δ nAChR subunits, rapsyn (Rsn), the Na+/K+-ATPase α subunit (αNa/K), and the mitochondrial voltage-dependent anion channel (VDAC) are indicated on the left. Bottom panel, the stained bands containing the nAChR α, β, γ, and δ subunits and αNa/K were excised from both gels, and 3H incorporation was determined by liquid scintillation counting. For each gel band, the average cpm and range (vertical bars) from the two gels are plotted.
FIGURE 4.
FIGURE 4.
[3H]TFD-etomidate photoincorporation within large fragments of the Torpedo nAChR α subunit. Polypeptides of the Torpedo nAChR-rich membranes, photolabeled with 0.8 μm [3H]TFD-etomidate in the absence or presence of agonist, were resolved on an 8% polyacrylamide gel, and after staining the band containing the α subunit was transferred to a 15% polyacrylamide mapping gel for digestion in gel with V8 protease, as described under “Experimental Procedures.” The bands containing α subunit fragments (αV8-20, αV8-18, and αV8-10), visualized by staining the mapping gel with Coomassie Blue, were excised, and the 3H eluted from each fragment was determined by liquid scintillation counting. The locations within the α subunit primary structure of αV8-20, αV8-18, and αV8-10 are indicated in the upper panel.
FIGURE 5.
FIGURE 5.
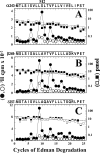
[3H]TFD-etomidate photolabeling within the M2 helices in the absence and presence of tetracaine. Shown are 3H (○, ▿) and PTH-amino acids (□, ◊) released during sequence analyses of nAChR subunit fragments beginning at the N termini of αM2 (A), βM2 (B), and δM2 (C) that were isolated from Torpedo nAChR photolabeled on a preparative scale with 0.8 μm [3H]TFD-etomidate in the absence (○, □) or presence (▿, ◊) of 100 μm tetracaine. EndoLys-C digests of αV8-20 were fractionated by rpHPLC (supplemental Fig. S1A) to isolate the fragment beginning at αMet-243; trypsin digests of β subunit and EndoLys-C digests of δ subunit were fractionated by Tricine SDS-PAGE and rpHPLC to isolate fragments beginning at βMet-249 and δMet-257 (supplemental Fig. S2, A and C, and S3, A and C). A, the fragment beginning at αMet-243 was the primary sequence (I0 = 6 pmol (−Tet) and 4 pmol (+Tet), with a secondary sequence beginning at αHis-186 (∼ 1 pmol). The 3H releases in cycles 9, 10, 13, and 16 of Edman degradation indicate photolabeling (−/+Tet) of αLeu-251 (1.2/0.5 cpm/pmol), αSer-252 (1.6/1.4 cpm/pmol), αVal-255 (0.6/0.3 cpm/pmol), and αLeu-258 (0.8/<0.2 cpm/pmol). B, the primary sequence began at βMet-249 (I0 = 36 and 38 pmol, − and +Tet), with secondary sequences beginning at βLys-216 (∼3 pmol) and trypsin fragments. For the control sample (○) the peaks of 3H release in cycles 9 and 13 indicated labeling of βLeu-257 and βLeu-261 at 1.7 and 0.6 cpm/pmol, with labeling of those amino acids in the presence of tetracaine (▿) reduced to 0.2 cpm/pmol. C, the primary sequence began at δMet-257 (I0 = 20 and 18 pmol, − and +Tet), with any secondary sequences at <5% of that level. The peaks of 3H release in cycles 9 and 13 indicated photolabeling (−/+Tet) of δLeu-265 (1.1/0.8 cpm/pmol) and δVal-269 (1.1/0.4 cpm/pmol).
FIGURE 6.
FIGURE 6.
[3H]TFD-etomidate photolabels amino acids in γM3 (γMet-295 and γMet-299) but not in βM3 or δM3. Shown are 3H (○,▿) and PTH-amino acids (□, ◊) released during sequencing through the M2-M3 loop and M3 helix of the nAChR γ (A), δ (B), and β (C) subunits isolated from nAChRs from the photolabeling of Fig. 5 in the absence (○, □) or presence (▿, ◊) of tetracaine. The major 3H peaks from rpHPLC fractionations of V8 protease digests of γ, δ, and β subunits (supplemental Fig. S4) were sequenced with OPA treatment at cycle 6 of Edman degradation (indicated by an arrow), which prevents further sequencing of peptides not containing a proline at this cycle and chemically isolates the subunit fragments beginning at γThr-276, δThr-281, and βThr-273, respectively. A, after treatment with OPA, sequencing continued for the fragment beginning at γThr-276 (I0 = 26 and 20 pmol; -and +Tet) and for the equivalent, contaminating δ subunit fragment, (δThr-281; I0 ∼3 pmol). In the cycles before OPA treatment, sequences were also present beginning at γIle-209 and γAsn-439 (each at ∼ 20 pmol), with OPA reducing those levels by >95%. The peaks of 3H release in cycles 20 and 24 indicated photolabeling of γMet-295 (7 cpm/pmol) and γMet-299 (5 cpm/pmol) in the absence and presence of tetracaine. B, after OPA treatment in cycle 6, the primary sequence began at δThr-281 (−Tet, I0 = 30 pmol) is shown. Based upon the levels of 3H release, photolabeling of any amino acid, if it occurred, was at <0.5 cpm/pmol. C, after OPA treatment, sequencing continued for fragments beginning at βThr-273 (□) and the contaminating fragment beginning at δ-Thr281 (8 pmol each). Photolabeling of any amino acids in βM3, if it occurred, would be at <0.5 cpm/pmol.
FIGURE 7.
FIGURE 7.
Agonist-enhanced [3H]TFD-etomidate photolabeling within αM2, βM2, and δM2. 3H (○, ●) and PTH-amino acids (□, ■) released during sequence analysis of nAChR subunit fragments beginning at the N termini of αM2 (A), βM2 (B), and δM2 (C) isolated from nAChRs photolabeled on a preparative scale with 0. 8 μm [3H]TFD-etomidate in the absence (○, □) or presence (●, ■) of 1 mm Carb. Tricine-PAGE and rpHPLC fractionations of the subunit digests are shown in supplemental Fig. S1B, S2, B and D, and S3, B and D. A, the primary sequence began at αMet243 (I0 = 7 (□) and 5 (■) pmol), with a secondary sequence beginning at βMet-249 (<2 pmol). The peaks of 3H release in cycles 6, 9, 10, 13, 16, and 20 of Edman degradation indicate photolabeling (−Carb/+Carb, in cpm/pmol) of αSer-248 (1.4/7.8), αLeu-251 (3.2/15), αSer-252 (2.8/27), αVal-255 (1.4/13), αLeu-258 (2/2), and αGlu-262 (1/4). B, the only sequence detected began at βMet-249 (I0 = 17 (□) and 18 (■) pmol). The peaks of 3H release in cycles 6, 9, 13, and 16 indicated labeling (−Carb/+Carb, in cpm/pmol) of βSer-254 (0.6/3.5), βLeu-257 (5/12), βVal-261 (2/11), and βLeu-265 (<0.3/3). C, the only sequence detected began at δMet-257 (I0 = 13 (□) and 19 (■) pmol). The peaks of 3H release in cycles 6, 9, 13, 16, and 20 indicated photolabeling (−Carb/+Carb, in cpm/pmol) of δLeu-262 (0.3/2.2), δLeu-265 (2.4/15), δVal-269 (2/5), δLeu-272 (<0.3/2.7), δGln-276 (<0.5/3.5).
FIGURE 8.
FIGURE 8.
Effect of agonist on [3H]TFD-etomidate photolabeling within γM3 (A), δM3 (B), and δM1. Shown are 3H (○, ●) and PTH-amino acids (□, ■) released during sequencing of subunit fragments from the photolabeling experiment of Fig. 7 of nAChRs in the absence (○, □) or presence (●, ■) of 1 mm Carb. A and B, photoincorporation within the M2-M3 loop and M3 helix was determined, as in Fig. 6, by sequence analysis of the major peaks of 3H recovered when V8 protease digests of γ (A) and δ (B) subunits were fractionated by rpHPLC with OPA treatment at cycle 6 of Edman degradation (indicated by arrow). A, after treatment with OPA in cycle 6, sequencing continued for the fragment beginning at γThr-276 (I0 = 12 (□) and 16 (■) pmol), with the equivalent, contaminating δ subunit fragment (δThr-281, I0 ∼ 4 pmol, both conditions) as a secondary sequence. The peaks of 3H release in cycles 20 and 24 indicated photolabeling (−Carb/+Carb, in cpm/pmol) of γMet-295 (11/6) and γMet-299 (7/4). B, after treatment with OPA in cycle 6, sequencing continued for the fragment beginning at δThr-281 (I0 = 17 (□) and 23 (■) pmol). The major peak of 3H release in cycle 8, seen only in the +Carb sample, indicated agonist-induced labeling of δIle-288 (+Carb, 3.7 cpm/pmol) in the δM2-M3 loop. C, the fragment beginning at δPhe-206 (□, -Carb, 25 pmol; ■, +Carb, 23 pmol), containing the δM1 helix was isolated by Tricine SDS-PAGE and rpHPLC from EndoLys-C digests of δ subunits (from an experiment with nAChRs photolabeled at 0.4 μm [3H]TFD-etomidate). The fragment beginning at δPhe-206 was recovered by rpHPLC from the same 10/14-kDa gel band as the δM2 fragment, with the δPhe-206 and δMet-257 fragments eluting at ∼50 and 70% organic, respectively (supplemental Fig. 3, C and D). Because the fragment beginning at δPhe-206 contains a proline at cycle 20, the sequencing filter was treated with OPA at cycle 20 to ensure that any 3H release after this cycle originated from the δM1 helix. The peaks of 3H release in cycles 27 and 31 in the +Carb sample indicated agonist-induced labeling of δPhe-232 and δCys-236 at 0.5 cpm/pmol.
FIGURE 9.
FIGURE 9.
Agonist-insensitive [3H]TFD-etomidate photolabeling in αM4 (top) and βM4 (bottom). Shown are 3H (○, ●) and PTH-amino acids (□, ■) released during sequencing of subunit fragments from the experiment of Fig. 7 of nAChR photolabeled by [3H]TFD-etomidate in the absence (○, □) or presence (●, ■) of 1 mm Carb. Top, the α subunit fragment beginning at αTyr-401 (7 pmol for each condition) containing the αM4 helix (indicated by the bar) was isolated along with an overlapping fragment beginning at αSer-388 (2 pmol) by rpHPLC fractionation of trypsin digests of the αV8-10 fragment supplemental Fig. S1C). The peaks of 3H release in cycles 13 and 15 indicated photolabeling labeling (−Carb/+Carb, in cpm/pmol) of αCys-412 (35/30) and αMet-415 (11/6) at the lipid-exposed face of αM4. Bottom, the fragment beginning at βAsp-427 (□, −Carb, 3.5 pmol; ■, +Carb, 1.8 pmol) containing the βM4 helix (indicated by the bar), was isolated by rpHPLC fractionation of polypeptides eluted from a gel band with apparent molecular mass of 7 kDa from a Tricine SDS-PAGE fractionation of trypsin digests of the β subunit. Each sample also contained the fragment beginning at βLys-216 before βM1 (3 pmol each condition). The 3H release at cycle 15 indicated photolabeling of βTyr-441(−Carb/+Carb, 17/16 cpm/pmol), as no 3H release was seen in cycle 15 when other fractions more enriched in the βLys-216 fragment were sequenced.
FIGURE 10.
FIGURE 10.
The binding sites for TFD-etomidate in the nAChR transmembrane domain. A, shown is a side view of a T. californica nAChR homology model (α, gold; β, blue; γ, green; δ, magenta), based on the T. marmorata nAChR structure (PDB code 2BG9 (4)). Connolly surface representations are included of an agonist (in red) in the agonist binding sites in the extracellular domain and of an ensemble of 20 TFD-etomidates (colored by atom) docked in the ion channel. A space-filling model of TFD-etomidate (230 Å3) is included for comparison. B–E, views of the nAChR transmembrane domain looking down the channel from the base of the extracellular domain (B), from the ion channel (C), or from the lipid interface (D and E), including Connolly surface representations of the volumes defined by the ensemble of the best energy minimized TFD-etomidate docking solutions within the lumen of the ion channel (B and E, 20 molecules, 615 Å3), in the pocket at the γ-α subunit interface (B–D, 12 molecules, 385 Å3), and in the pocket at the extracellular end of the δ subunit helix bundle (B and E, 10 molecules, 240 Å3). In B--E, the amino acids photolabeled by [3H]TFD-etomidate are indicated in stick format with color coding: within the ion channel (red, positions M2-9 and M2-13), at the γ-α interface (green, αSer-252; purple, γMet-295; pink, γMet-299), within the δ subunit helix bundle (cyan, δIle-288, δPhe-232, and δCys-236). Shown in orange in B and E are the amino acids at the lipid interface in αM4 and βM4 photolabeled by [3H]TFD-etomidate and [125I]TID (αCys-412, αMet-415, βTyr-441) and in D are those in γM3 photolabeled by [125I]TID. Also included, indicated in sky blue, is γMet-291, which is photolabeled by [3H]benzophenone (16). To highlight the different locations in the M3 helices of the amino acids photolabeled by TID at the lipid interface (34) compared with those photolabeled by TFD-etomidate, TDBzl-etomidate or benzophenone at the γ-α subunit interface, panel D, also includes a helical wheel representation of γM3 and a sequence alignment of γM3, δM3, and βM3, with the same color-coding indicating the amino acids photolabeled only by TFD-etomidate (purple, γMet-295), by TFD-etomidate and TDBzl-etomidate (magenta, γMet-299), by TID at the lipid interface (orange, γPhe-292/γLeu-296/γAsn-300 in γM3, δMet-294/δSer-298,/δGly-303/δ-Asn307 in δM3, and βIle-290/βPhe-294 in βM3), by benzophenone (sky blue, γMet-291/βMet-288), or by TID and benzophenone (brown, β-Met285).

References

    1. Wells G. B. (2008) Front. Biosci. 13, 5479–5510 - PMC - PubMed
    1. Albuquerque E. X., Pereira E. F., Alkondon M., Rogers S. W. (2009) Physiol. Rev. 89, 73–120 - PMC - PubMed
    1. Miller P. S., Smart T. G. (2010) Trends Pharmacol. Sci. 31, 161–174 - PubMed
    1. Unwin N. (2005) J. Mol. Biol. 346, 967–989 - PubMed
    1. Hilf R. J., Dutzler R. (2009) Nature 457, 115–118 - PubMed

Publication types