

Chromatin dynamics of gene activation and repression in response to interferon alpha (IFN(alpha)) reveal new roles for phosphorylated and unphosphorylated forms of the transcription factor STAT2
- PMID: 21498520
- PMCID: PMC3121502
- DOI: 10.1074/jbc.M111.231068
Chromatin dynamics of gene activation and repression in response to interferon alpha (IFN(alpha)) reveal new roles for phosphorylated and unphosphorylated forms of the transcription factor STAT2
Abstract
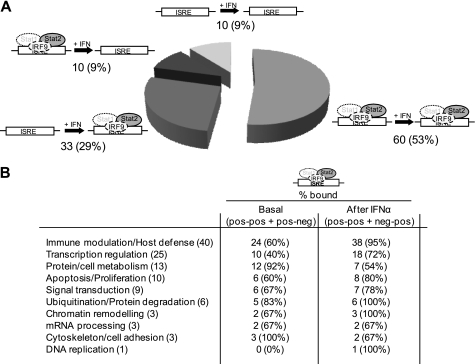
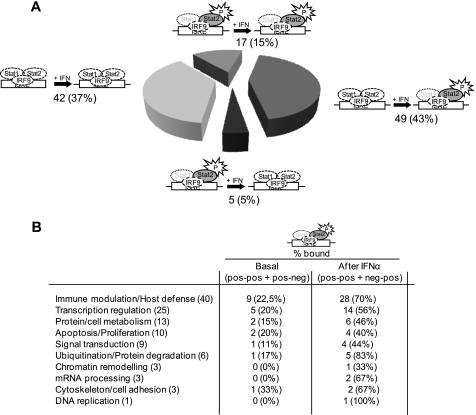
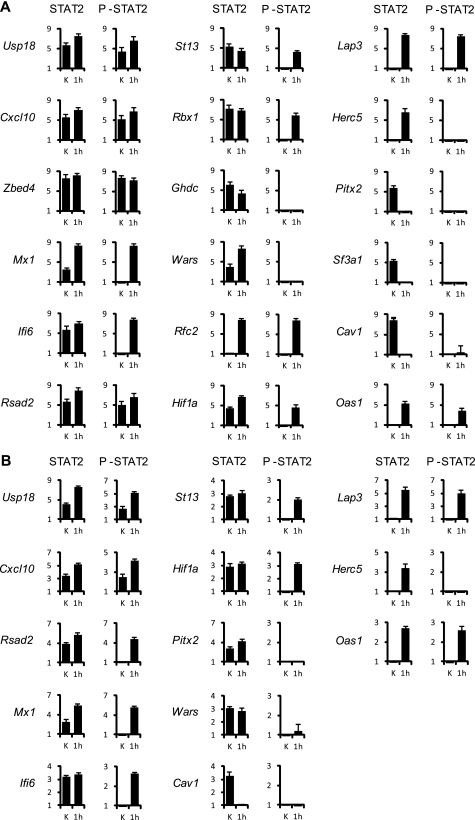
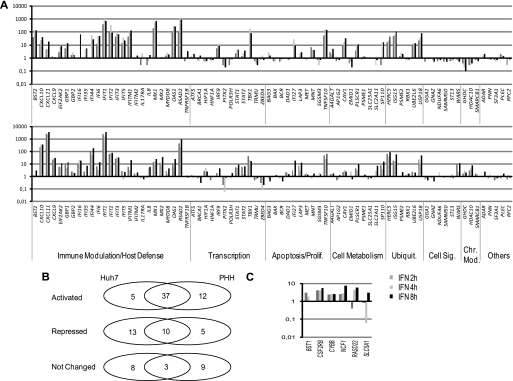
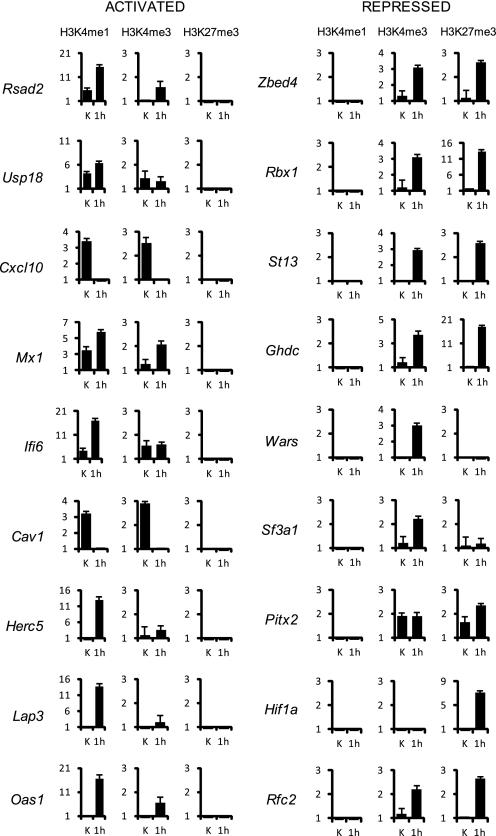
Signal transducer and activator of transcription 2 (STAT2), the critical component of type I interferons signaling, is a prototype latent cytoplasmic signal-dependent transcription factor. Activated tyrosine-phosphorylated STAT2 associates with STAT1 and IRF9 to bind the ISRE elements in the promoters of a subset of IFN-inducible genes (ISGs). In addition to activate hundreds of ISGs, IFNα also represses numerous target genes but the mechanistic basis for this dual effect and transcriptional repression is largely unknown. We investigated by ChIP-chip the binding dynamics of STAT2 and "active" phospho(P)-STAT2 on 113 putative IFNα direct target promoters before and after IFNα induction in Huh7 cells and primary human hepatocytes (PHH). STAT2 is already bound to 62% of our target promoters, including most "classical" ISGs, before IFNα treatment. 31% of STAT2 basally bound promoters also show P-STAT2 positivity. By correlating in vivo promoter occupancy with gene expression and changes in histone methylation marks we found that: 1) STAT2 plays a role in regulating ISGs expression, independently from its phosphorylation; 2) P-STAT2 is involved in ISGs repression; 3) "activated" ISGs are marked by H3K4me1 and H3K4me3 before IFNα; 4) "repressed" genes are marked by H3K27me3 and histone methylation plays a dominant role in driving IFNα-mediated ISGs repression.
Figures
Similar articles
-
A Positive Feedback Amplifier Circuit That Regulates Interferon (IFN)-Stimulated Gene Expression and Controls Type I and Type II IFN Responses.Front Immunol. 2018 May 28;9:1135. doi: 10.3389/fimmu.2018.01135. eCollection 2018. Front Immunol. 2018. PMID: 29892288 Free PMC article. Review.
-
STAT2/IRF9 directs a prolonged ISGF3-like transcriptional response and antiviral activity in the absence of STAT1.Biochem J. 2015 Mar 15;466(3):511-24. doi: 10.1042/BJ20140644. Biochem J. 2015. PMID: 25564224 Free PMC article.
-
Unphosphorylated ISGF3 drives constitutive expression of interferon-stimulated genes to protect against viral infections.Sci Signal. 2017 Apr 25;10(476):eaah4248. doi: 10.1126/scisignal.aah4248. Sci Signal. 2017. PMID: 28442624
-
p53-paralog DNp73 oncogene is repressed by IFNα/STAT2 through the recruitment of the Ezh2 polycomb group transcriptional repressor.Oncogene. 2011 Jun 9;30(23):2670-8. doi: 10.1038/onc.2010.635. Epub 2011 Mar 14. Oncogene. 2011. PMID: 21399658 Free PMC article.
-
The unique role of STAT2 in constitutive and IFN-induced transcription and antiviral responses.Cytokine Growth Factor Rev. 2016 Jun;29:71-81. doi: 10.1016/j.cytogfr.2016.02.010. Epub 2016 Mar 18. Cytokine Growth Factor Rev. 2016. PMID: 27053489 Review.
Cited by
-
Interferon Response in Hepatitis C Virus-Infected Hepatocytes: Issues to Consider in the Era of Direct-Acting Antivirals.Int J Mol Sci. 2020 Apr 8;21(7):2583. doi: 10.3390/ijms21072583. Int J Mol Sci. 2020. PMID: 32276399 Free PMC article. Review.
-
The role of signal transducer and activator of transcription-2 in the interferon response.J Interferon Cytokine Res. 2012 Mar;32(3):103-10. doi: 10.1089/jir.2011.0099. Epub 2012 Jan 26. J Interferon Cytokine Res. 2012. PMID: 22280068 Free PMC article. Review.
-
Interplay between Janus Kinase/Signal Transducer and Activator of Transcription Signaling Activated by Type I Interferons and Viral Antagonism.Front Immunol. 2017 Dec 11;8:1758. doi: 10.3389/fimmu.2017.01758. eCollection 2017. Front Immunol. 2017. PMID: 29312301 Free PMC article. Review.
-
A Positive Feedback Amplifier Circuit That Regulates Interferon (IFN)-Stimulated Gene Expression and Controls Type I and Type II IFN Responses.Front Immunol. 2018 May 28;9:1135. doi: 10.3389/fimmu.2018.01135. eCollection 2018. Front Immunol. 2018. PMID: 29892288 Free PMC article. Review.
-
Interferon-Stimulated Genes Are Transcriptionally Repressed by PR in Breast Cancer.Mol Cancer Res. 2017 Oct;15(10):1331-1340. doi: 10.1158/1541-7786.MCR-17-0180. Epub 2017 Jul 6. Mol Cancer Res. 2017. PMID: 28684637 Free PMC article.
References
-
- Stark G. R., Kerr I. M., Williams B. R., Silverman R. H., Schreiber R. D. (1998) Annu. Rev. Biochem. 67, 227–264 - PubMed
-
- Sheppard P., Kindsvogel W., Xu W., Henderson K., Schlutsmeyer S., Whitmore T. E., Kuestner R., Garrigues U., Birks C., Roraback J., Ostrander C., Dong D., Shin J., Presnell S., Fox B., Haldeman B., Cooper E., Taft D., Gilbert T., Grant F. J., Tackett M., Krivan W., McKnight G., Clegg C., Foster D., Klucher K. M. (2003) Nat. Immunol. 4, 63–68 - PubMed
-
- Kotenko S. V., Gallagher G., Baurin V. V., Lewis-Antes A., Shen M., Shah N. K., Langer J. A., Sheikh F., Dickensheets H., Donnelly R. P. (2003) Nat. Immunol. 4, 69–77 - PubMed
-
- Brierley M. M., Fish E. N. (2002) J. Interferon. Cytokine. Res. 22, 835–845 - PubMed
-
- Uddin S., Platanias L. C. (2004) J. Biochem. Mol. Biol. 37, 635–641 - PubMed
Publication types
MeSH terms
Substances
LinkOut - more resources
Full Text Sources
Research Materials
Miscellaneous
