

doi: 10.1101/gad.2016211.
Autophagy-deficient mice develop multiple liver tumors
Affiliations
- PMID: 21498569
- PMCID: PMC3078705
- DOI: 10.1101/gad.2016211
Item in Clipboard
Autophagy-deficient mice develop multiple liver tumors
Genes Dev.
.
Abstract
Autophagy is a major pathway for degradation of cytoplasmic proteins and organelles, and has been implicated in tumor suppression. Here, we report that mice with systemic mosaic deletion of Atg5 and liver-specific Atg7⁻/⁻ mice develop benign liver adenomas. These tumor cells originate autophagy-deficient hepatocytes and show mitochondrial swelling, p62 accumulation, and oxidative stress and genomic damage responses. The size of the Atg7⁻/⁻ liver tumors is reduced by simultaneous deletion of p62. These results suggest that autophagy is important for the suppression of spontaneous tumorigenesis through a cell-intrinsic mechanism, particularly in the liver, and that p62 accumulation contributes to tumor progression.
Figures
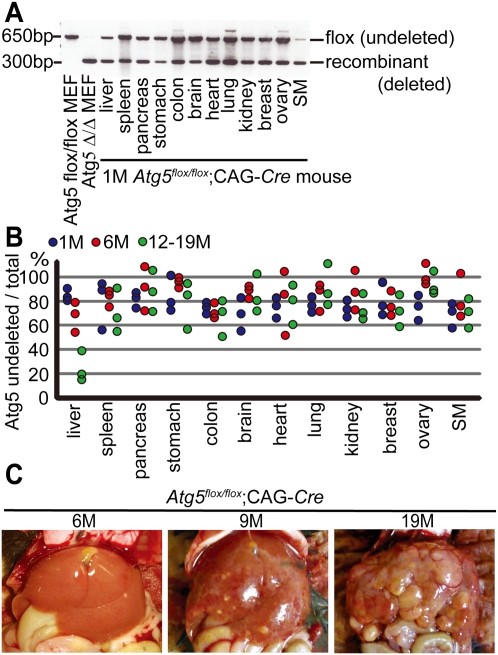
Mosaic deletion of Atg5 causes multiple liver tumors. (A) Genotyping of Atg5flox/flox;CAG-Cre mouse organs by PCR at 1 mo. Positions of the Atg5 flox (undeleted) and recombinant (deleted) alleles are indicated. Atg5Δ/Δ mouse embryonic fibroblasts (MEFs) indicates Atg5flox/flox MEFs infected with the adenovirus vector coding Cre recombinase. (SM) Skeletal muscle. (B) Real-time quantitative PCR with the Atg5 flox allele-specific primers. Genomic DNA is extracted from various tissues of Atg5flox/flox;CAG-Cre mice and Atg5flox/flox mice at 1 mo (blue circles), 6 mo (red circles), and 12–19 mo (green circles) (n = 3). The relative DNA quantity of the Atg5 flox allele is normalized to that of Atg14. Ratio (percentage) of flox allele in Atg5flox/flox;CAG-Cre organs to that in Atg5flox/flox organs is shown. (C) Representative gross anatomy of Atg5flox/flox;CAG-Cre mice analyzed at 6 mo (n = 3), 9 mo (n = 6), and 18–19 mo (n = 9).
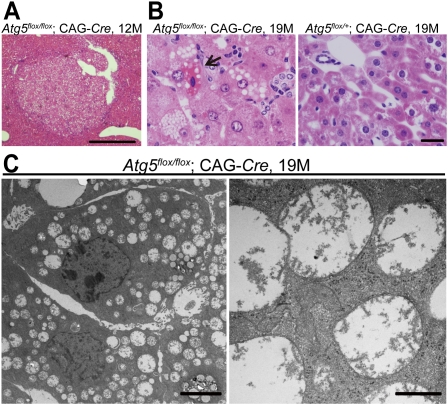
Histological findings of the liver in Atg5flox/flox;CAG-Cre mice. (A) Hematoxylin and eosin (H&E) staining of Atg5flox/flox;CAG-Cre (n = 2). Bar, 500 μm. (B) High-power-field images of H&E staining of the livers from Atg5flox/flox;CAG-Cre mice (n = 4) and an Atg5flox/+; CAG-Cre mouse (n = 4) at 19 mo. The arrow shows a necrotic hepatocyte observed in a Atg5flox/flox;CAG-Cre mouse liver at 19 mo. Bar, 20 μm. (C) Electron micrographs of Atg5flox/flox;CAG-Cre mouse hepatocytes (n = 2). (Right) Magnified image shows swollen mitochondria. Bars: left, 4 μm; right, 500 nm.
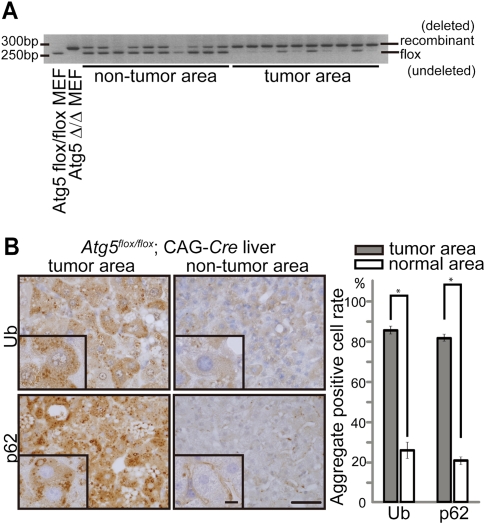
Liver tumors are derived from Atg5-deleted hepatocytes. (A) Genotyping of liver samples microdissected from the tumor and nontumor areas of 9-mo-old Atg5flox/flox;CAG-Cre mice. Positions of the Atg5 flox (undeleted) and recombinant (deleted) alleles are indicated. Atg5Δ/Δ MEFs indicate Atg5flox/flox MEFs infected with the adenovirus vector coding Cre recombinase. (B) Immunohistochemical staining for ubiquitin and p62 of the tumor and nontumor areas of Atg5flox/flox;CAG-Cre mouse livers. The graph shows the percentage of cells with ubiquitin- or p62-positive aggregates in the tumor (gray) and nontumor (white) areas. One-hundred hepatocytes in 10 tumor and nontumor areas (total 1000 cells for each) were analyzed at 9 mo. Data are mean ± SE values from four mice. (*) P < 0.01. Bars: 40 μm; insets, 10 μm.
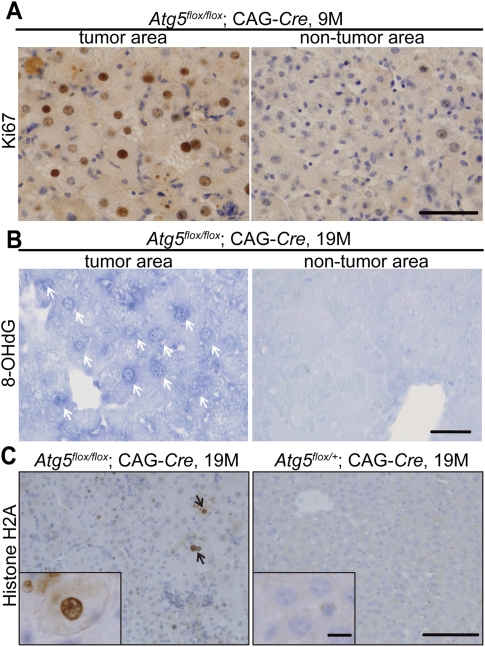
Induction of the oxidative stress and DNA damage responses in Atg5flox/flox;CAG-Cre mouse livers. (A) Immunohistochemical analysis of the tumor and nontumor areas in Atg5flox/flox;CAG-Cre mouse livers at 19 mo for Ki-67 expression. n = 3. Bar, 50 μm. (B) 8-OHdG staining of the tumor and nontumor areas in the liver of Atg5flox/flox;CAG-Cre mice at 19 mo. White arrows indicate anti-8-OHdG antibody-positive nuclei (n = 3). Bar, 40 μm. (C) Phospho-histone H2A.X staining in the liver of Atg5flox/flox;CAG-Cre (n = 3) and Atg5flox/+;CAG-Cre (n = 3) mice at 19 mo. Black arrows indicate phospho-histone H2A.X-positive nuclei. Bars: 100 μm; insets, 10 μm.
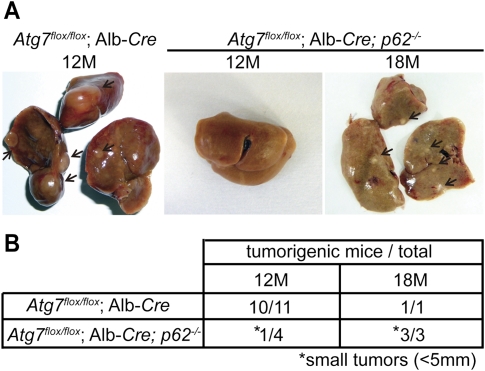
Suppression of tumor progression in liver-specific ATG7-deficient mice by p62 deletion. (A) Representative gross anatomy of Atg7flox/flox;Alb-Cre mice analyzed at 12 mo (n = 11) and Atg7flox/flox;Alb-Cre; p62−/− mice analyzed at 12 mo (n = 4) and 18 mo (n = 3). Tumors are indicated by arrows. (B) Summary of tumor formation in Atg7flox/flox;Alb-Cre and Atg7flox/flox;Alb-Cre; p62−/− mice. (*) Small tumors (<5 mm).
References
-
- Cadet J, Douki T, Gasparutto D, Ravanat JL 2003. Oxidative damage to DNA: formation, measurement and biochemical features. Mutat Res 531: 5–23 - PubMed
Publication types
MeSH terms
Substances
LinkOut - more resources
Full Text Sources
Other Literature Sources
Medical
Molecular Biology Databases