. 2011 Apr 15;25(8):814-30.
doi: 10.1101/gad.2000211.

A kinase shRNA screen links LATS2 and the pRB tumor suppressor

Affiliations

A kinase shRNA screen links LATS2 and the pRB tumor suppressor

Katrin Tschöp et al. Genes Dev. .

Abstract

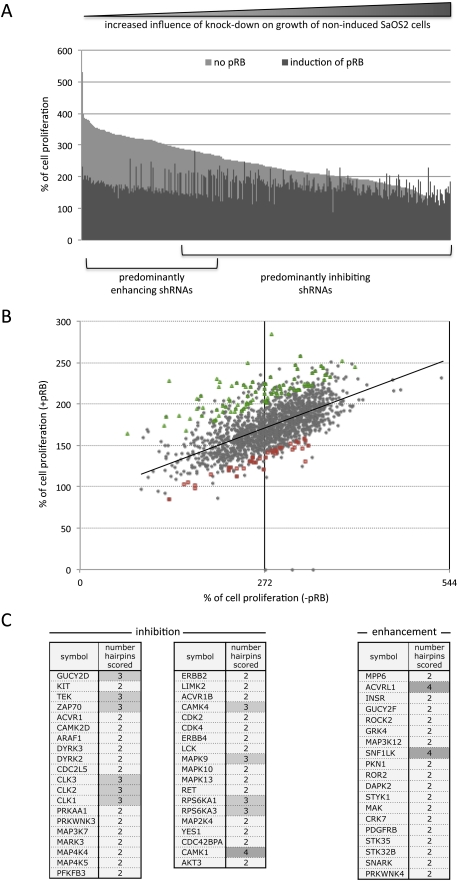
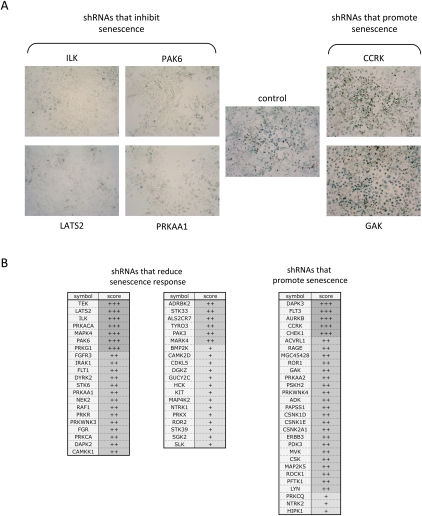
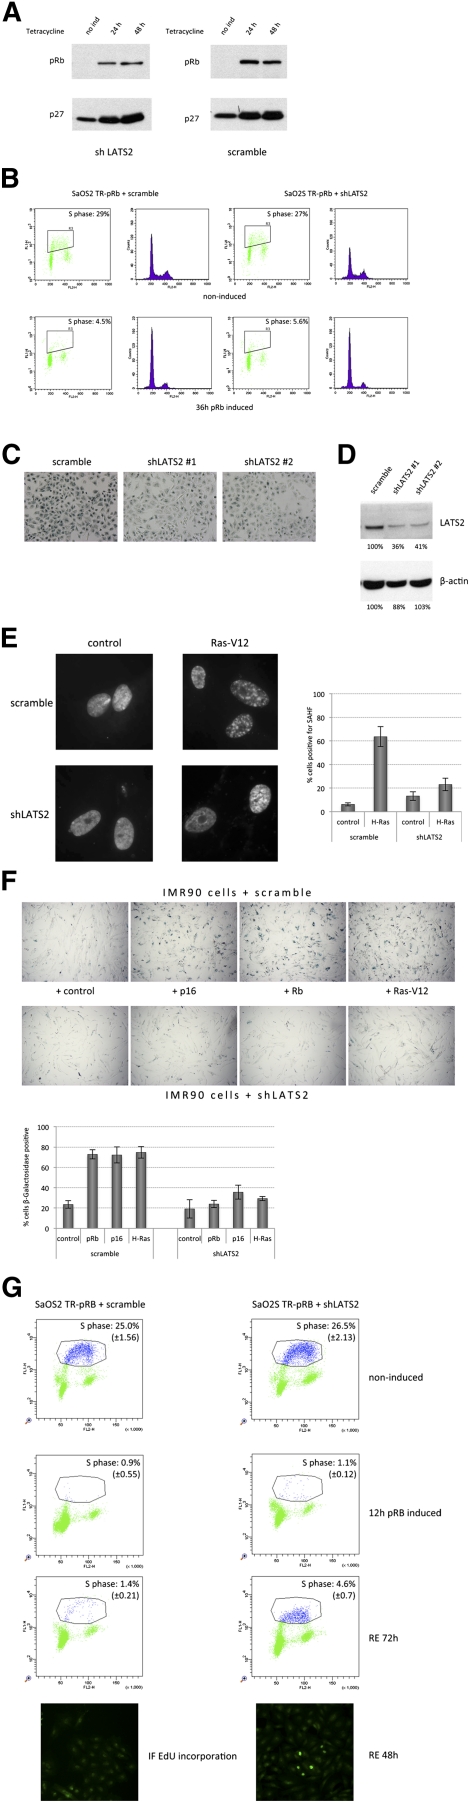
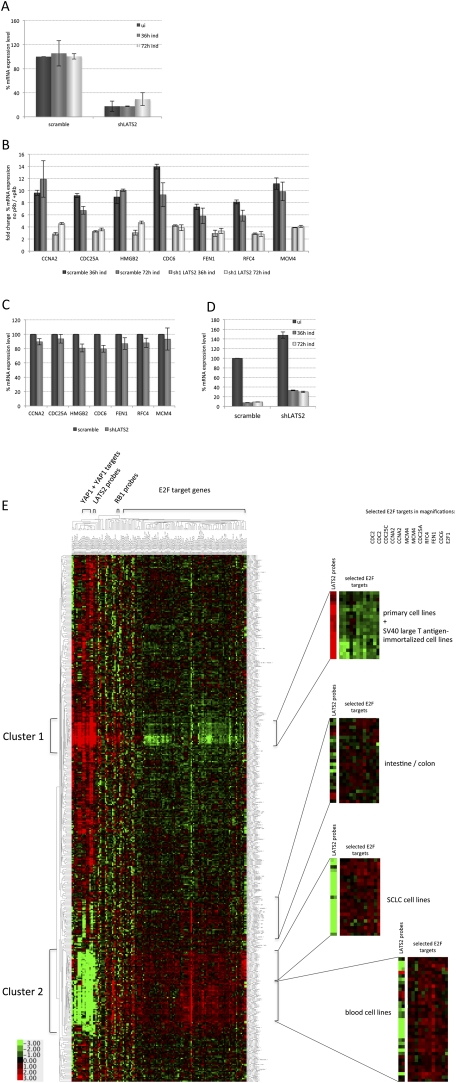
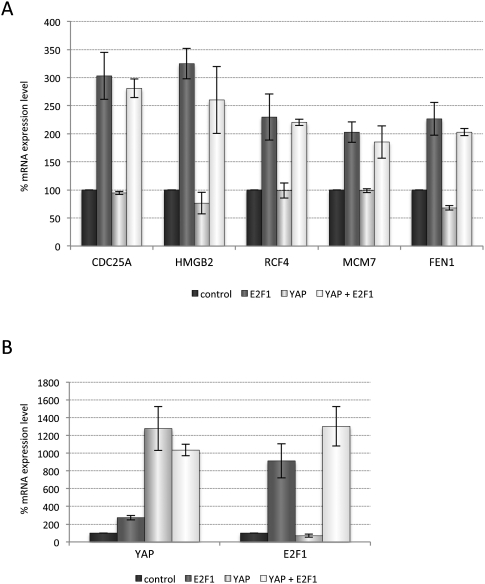
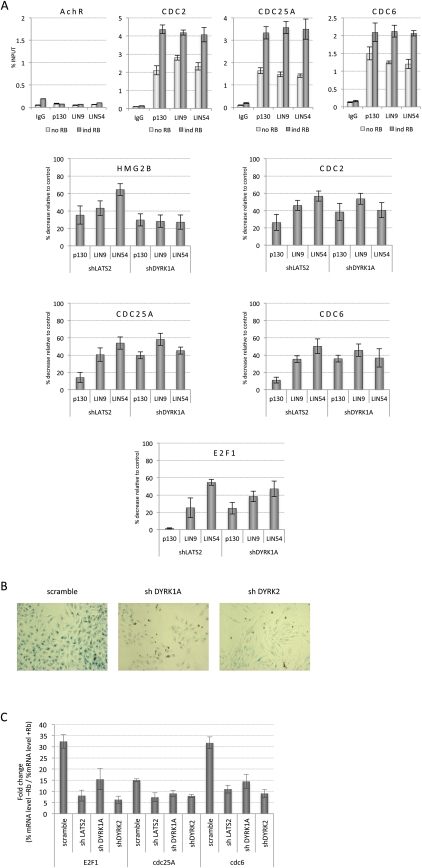
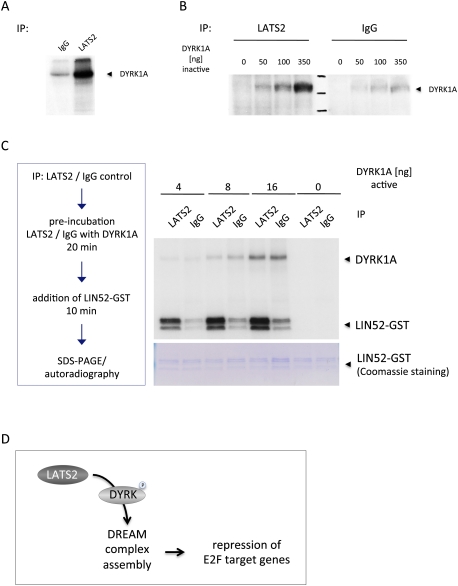
pRB-mediated inhibition of cell proliferation is a complex process that depends on the action of many proteins. However, little is known about the specific pathways that cooperate with the Retinoblastoma protein (pRB) and the variables that influence pRB's ability to arrest tumor cells. Here we describe two shRNA screens that identify kinases that are important for pRB to suppress cell proliferation and pRB-mediated induction of senescence markers. The results reveal an unexpected effect of LATS2, a component of the Hippo pathway, on pRB-induced phenotypes. Partial knockdown of LATS2 strongly suppresses some pRB-induced senescence markers. Further analysis shows that LATS2 cooperates with pRB to promote the silencing of E2F target genes, and that reduced levels of LATS2 lead to defects in the assembly of DREAM (DP, RB [retinoblastoma], E2F, and MuvB) repressor complexes at E2F-regulated promoters. Kinase assays show that LATS2 can phosphorylate DYRK1A, and that it enhances the ability of DYRK1A to phosphorylate the DREAM subunit LIN52. Intriguingly, the LATS2 locus is physically linked with RB1 on 13q, and this region frequently displays loss of heterozygosity in human cancers. Our results reveal a functional connection between the pRB and Hippo tumor suppressor pathways, and suggest that low levels of LATS2 may undermine the ability of pRB to induce a permanent cell cycle arrest in tumor cells.


Figures

Figure 1.
Figure 1.
shRNAs that modify pRB-induced growth arrest. After infection of SaOS2 TR-pRB cells with shRNAs targeting different kinases and selection with puromycin for 3 d, cells were induced to express pRB or kept without tetracycline to serve as controls. Cell viability was analyzed using the Alamar blue assay. The percentage of growth was calculated relative to the 0-h time point. The FR after 96 h was calculated as the ratio between percent proliferation − pRB/percent proliferation + pRB and was used to score for shRNAs that influenced pRB-mediated cell cycle arrest. (A) Percentage of growth of uninduced (light) or induced (dark) cells for all hairpins that either reduce or increase the FR with a Z-score of >|2|. The shRNAs in the graph are ranked according to their effect on the growth of the uninduced cells. shRNAs that enhanced proliferation arrest (increased FR) are clustered mainly to the left, while those that reduce the effect of pRB (decreased FR) are to the right. Hits are evident due to their aberrant pattern. (B) Two-dimensional scatter plot of the pRB-induced proliferation arrest screen results. Each dot represents percent growth values for the same shRNA from uninduced (−pRB) cells (X-axis) and from cells with induction of pRB (Y-axis). The majority of shRNAs shows similar ratios of percent proliferation between uninduced (−pRB) and induced (+pRB) cells, and therefore appears along the trend line. The shRNAs that change this ratio appear either above (inhibitors of the pRB-mediated arrest) or below (enhancers of the pRb-mediated arrest) this line. The distance from the trend line corresponds to the strength of the effect. Shown in green (inhibitors) or red (enhancers) are the genes that significantly alter pRB-induced cell cycle arrest. (C) List of kinases whose knockdown inhibited or enhanced G1 arrest. Shown are the genes that differed at least three standard deviations from the trend line and scored with two or more shRNAs.
Figure 2.
Figure 2.
Knockdown of different kinases alter the pRB-induced increase in SA-β-gal activity. SaOS2 TR-pRB cells were infected, selected, and induced as described in Figure 1. After 84 h of pRB expression, cells were fixed and stained for SA-β-gal (blue), a classical marker of senescence. The intensity of the staining was analyzed by light microscopy (10× objective) and scored using a scale from 1 (reduced) to 5 (enhanced). (A) Examples of SA-β-gal staining of SAOS2 cells following shRNA knockdown of indicated genes and 84 h of induction of pRB from analyzed 96-well plates. (B) List of shRNAs that inhibited (green) or enhanced (red) the senescence phenotype induced by pRB. The hairpins are shown ranked in decreasing order, depending on number of hairpins that scored per gene and intensity of staining. (+++) Strong change with two or more hairpins; (++) strong and medium change with two or more hairpins; (+) medium change with two hairpins.
Figure 3.
Figure 3.
LATS2 is required for pRB-dependent senescence. The effect of shRNA-mediated LATS2 knockdown on pRB-dependent G1 arrest and senescence. (A) Knockdown of LATS2 does not interfere with p27CIP/KIP induction following pRB expression. Protein extracts were prepared, and equal amounts of protein were subjected to SDS-PAGE and Western analysis for the indicated proteins. (B) Two-dimensional FACS analysis of SaOS2 cells after pRB induction. Control or LATS2 shRNAs were transduced into SaOS2 cells. After 36 h of tetracycline induction, cells were pulsed with BrdU, fixed, and subjected to flow cytometric analysis. Knockdown of LATS2 does not interfere with pRB-induced G1 arrest. The box highlights S-phase cells marked by BrdU. The cell cycle profile is represented in a FL2-H histogram (DNA content analyzed by propidium iodide staining). (C) shRNAs against LATS2 decrease SA-β-gal staining in SaOS2 cells after 84 h of induction of pRB expression. Cells were transduced with either a scrambled control shRNA or two different shRNAs against LATS2. LATS2 shRNAs show a reduced level of SA-β-gal staining (blue) compared with control shRNA-containing cells (scramble). (D) Western blot analysis of LATS2 expression after knockdown using two independent shRNAs. Protein abundance was determined by digital quantification (Adobe Photoshop) from Western blot scans. Each value was converted to percentage of protein level in the scramble shRNA control sample. (E) Reduced LATS2 expression diminishes SAHF formation after H-RasV12 expression. IMR90 cells with either LATS2 shRNA or control shRNA (scramble) knockdown were infected with lentiviruses containing either empty vector control or H-RasV12. After 9 d post-infection of incubation, cells were fixed and stained with DAPI. Enlarged images of nuclei are shown at 100× magnification. (Bar graph) Quantification shows the percentage of cells positive for SAHF. (F) LATS2 knockdown reduces SA-β-gal staining in IMR90 cells that were induced to senesce by expressing p16, pRB, or H-rasV12. Cells were fixed and stained for the senescence marker SA-β-gal 9 d after introduction of the indicated constructs or a control vector. (Bar graph) Quantification shows the percentage of cells positive for β-gal. (G) Depletion of LATS2 enables cells to escape pRB-induced G1 arrest. FACS analysis is shown for SaOS-TR-pRB cells containing shRNA against LATS2 or scramble control. The top panel shows uninduced cells. The second panel shows cells after 12 h of pRB induction. The third panel shows cells after 12 h of pRB induction and a 72-h chase (in the absence of induction). Although control cells remain arrested, a subset of shLATS2 cells starts incorporation of EdU after 72 h of release. The bottom panel shows immunofluorescence images of the EdU-incorporating cells (green nuclei) in addition to S-phase percentages shown by flow cytometry dot plots.
Figure 4.
Figure 4.
LATS2 is required for complete repression of E2F target genes by pRB. E2F target gene expression was analyzed after knockdown of LATS2 and puromycin selection. Total RNA of SaOS2 cells was extracted and reverse-transcribed to prepare cDNA. qPCR was carried out and the mRNA expression levels of indicated genes were analyzed using the level of GAPDH as a reference. The Y-axis represents the percentage of mRNA expression of the indicated genes relative to the expression level of noninduced scrambled shRNA-containing control cells normalized to GAPDH (set to 100%). Error bars represent the standard deviation of three data points. (A) qPCR analysis confirms the reduction of LATS2 expression level in the shRNA-treated cells that were analyzed for E2F target gene expression (shown in B) without and with induction of pRB expression. (B) Comparison of E2F target gene expression in control cells and LATS2 shRNA-containing cells before and after induction of pRB expression for 36 h or 72 h. The bar graph represents the fold change of E2F target gene expression in −pRB versus +pRB cells. (C) The effect of LATS2 knockdown on E2F target gene expression in uninduced SaOS2-TR-pRB cells analyzed by qPCR. (D) qPCR analysis of E2F1 mRNA levels in control and LATS2 knockdown cells. (E) Microarray expression data derived from tumor cell lines support the idea of cooperation between the Hippo pathway kinase LATS2 and the pRB–E2F pathway. The heat map represents the hierarchical clustering analysis of the gene expression data for E2F target genes, RB1, LATS2, and other Hippo pathway members such as YAP and YAP target genes. Horizontal columns represent individual genes and vertical rows represent the separate cell lines from a panel of 428 cancer and normal cell lines (Supplemental Table S6). Red and green correspond to the high and low expression of the gene transcripts, respectively. The bar indicates relative expression of transcripts using a log2 transformed scale. The statistical analysis of the correlation between expression of LATS2 and E2F target genes resulted in a P-value of 0.014.
Figure 5.
Figure 5.
Analysis of YAP1- or E2F1-dependent activation of E2F target genes. YAP1, the transcriptional coactivator that is negatively regulated by the Hippo pathway, does not increase transcriptional activation of E2F target genes. (A) Analysis of the indicated E2F target gene mRNA expression levels in SaOS2 cells expressing a constitutively active YAP1 variant (S127A), tetracycline-induced E2F1, or the combination of both. (B) The YAP1 and E2F1 expression levels were analyzed in parallel to the E2F targets in A to confirm the increase in expression levels.
Figure 6.
Figure 6.
LATS2 promotes DREAM complex-mediated silencing of E2F target genes. shRNA-mediated knockdown of LATS2 and the DYRK kinases causes similar defects in pRB-mediated phenotypes. (A) Analysis of mammalian DREAM complex components bound to E2F target gene promoters. SaOS2 cells with or without induced pRB expression and containing shRNAs targeting LATS2, DYRK1A, or scramble control were analyzed by ChIP using antibodies against p130, LIN9, and LIN54. (Top panel) Binding to the indicated E2F target gene promoters or control AchR promoter was measured by qPCR and is presented as percentage of input. The bottom panel shows the percent decrease of binding in either shLATS2- or shDYRK1A-containing cells compared with scramble control cells after 36 h of pRB expression. (B) Decrease in pRB-induced appearance of the SA-β-gal senescence marker after knockdown of DYRK1A or DYRK2. shRNAs against the DYRK1A and DYRK2 decrease SA-β-gal staining in SaOS2 cells after induction of pRB expression. (C) DYRK1A or DYRK2 knockdown impairs the pRB-mediated repression of E2F target genes. qPCR analysis of E2F target gene mRNA levels after knockdown of DYRK1A, DYRK2, or LATS2 and induction of pRB for 36 h. The mRNA level of GAPDH is used as a reference. The expression level of noninduced scramble control shRNA-containing cells normalized to GAPDH is set to 100%. The graph shows the fold change of gene expression after pRB induction. Error bars represent the standard deviation of three data points.
Figure 7.
Figure 7.
LATS2 promotes DYRK1A activity. LATS2 phosphorylates DYRK1A and enhances its kinase activity in vitro. (A) LATS2 kinase modifies DYRK1A. LATS2-V5 was expressed in 293T cells, immunoprecipitated, and subjected to a 32P-γATP in vitro kinase assay with 1 μg of inactivated DYRK1A as a substrate. Phosphorylation of DYRK1A is visualized by autoradiography. (B) LATS2 in vitro kinase assay as shown in A, with increasing amounts of inactivated DYRK1A provided as substrate. (C) LATS2 increases the ability of DYRK1A to phosphorylate LIN52. The DYRK1A kinase was preincubated with LATS2-V5 in kinase buffer containing unlabeled ATP and was subsequently assayed in an in vitro kinase reaction as shown in A. Phosphorylation of purified LIN52-GST is used to assess DYRK1A activity. Potentially, the increase in phosphorylated LIN52-GST could be due to an increase in DYRK1A enzymatic activity or enhanced substrate specificity toward LIN52. Autophosphorylation of DYRK1A results in the indicated band. (D) Model illustrating the relationship between LATS2 and E2F target gene repression. See the text for details.

Comment in

  • Sweet DREAMs for Hippo.
    Dick FA, Mymryk JS. Dick FA, et al. Genes Dev. 2011 May 1;25(9):889-94. doi: 10.1101/gad.2050411. Genes Dev. 2011. PMID: 21536729 Free PMC article.

Similar articles

Cited by

References

    1. Adams PD 2007. Remodeling of chromatin structure in senescent cells and its potential impact on tumor suppression and aging. Gene 397: 84–93 - PMC - PubMed
    1. Adams PD 2009. Healing and hurting: molecular mechanisms, functions, and pathologies of cellular senescence. Mol Cell 36: 2–14 - PubMed
    1. Alexander K, Hinds PW 2001. Requirement for p27(KIP1) in retinoblastoma protein-mediated senescence. Mol Cell Biol 21: 3616–3631 - PMC - PubMed
    1. Alexander K, Yang HS, Hinds PW 2003. pRb inactivation in senescent cells leads to an E2F-dependent apoptosis requiring p73. Mol Cancer Res 1: 716–728 - PubMed
    1. Alonso A, Rahmouni S, Williams S, van Stipdonk M, Jaroszewski L, Godzik A, Abraham RT, Schoenberger SP, Mustelin T 2003. Tyrosine phosphorylation of VHR phosphatase by ZAP-70. Nat Immunol 4: 44–48 - PubMed

Publication types

MeSH terms