. 2011 Jul 1;71(13):4585-97.
doi: 10.1158/0008-5472.CAN-11-0127. Epub 2011 Apr 15.

Overcoming trastuzumab resistance in breast cancer by targeting dysregulated glucose metabolism

Affiliations

Overcoming trastuzumab resistance in breast cancer by targeting dysregulated glucose metabolism

Yuhua Zhao et al. Cancer Res. .

Abstract

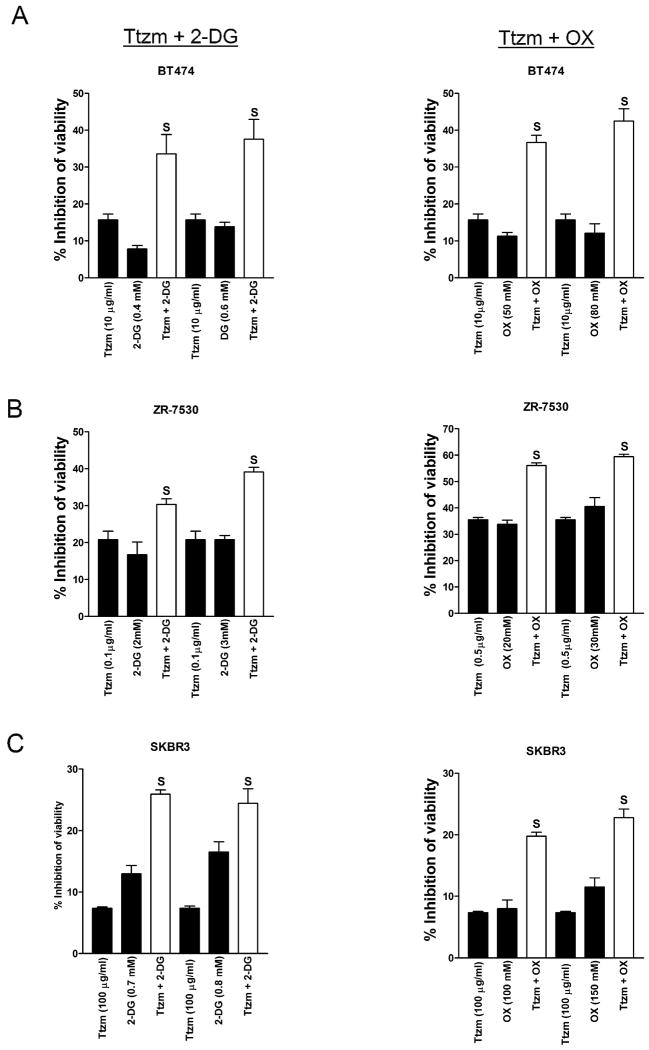
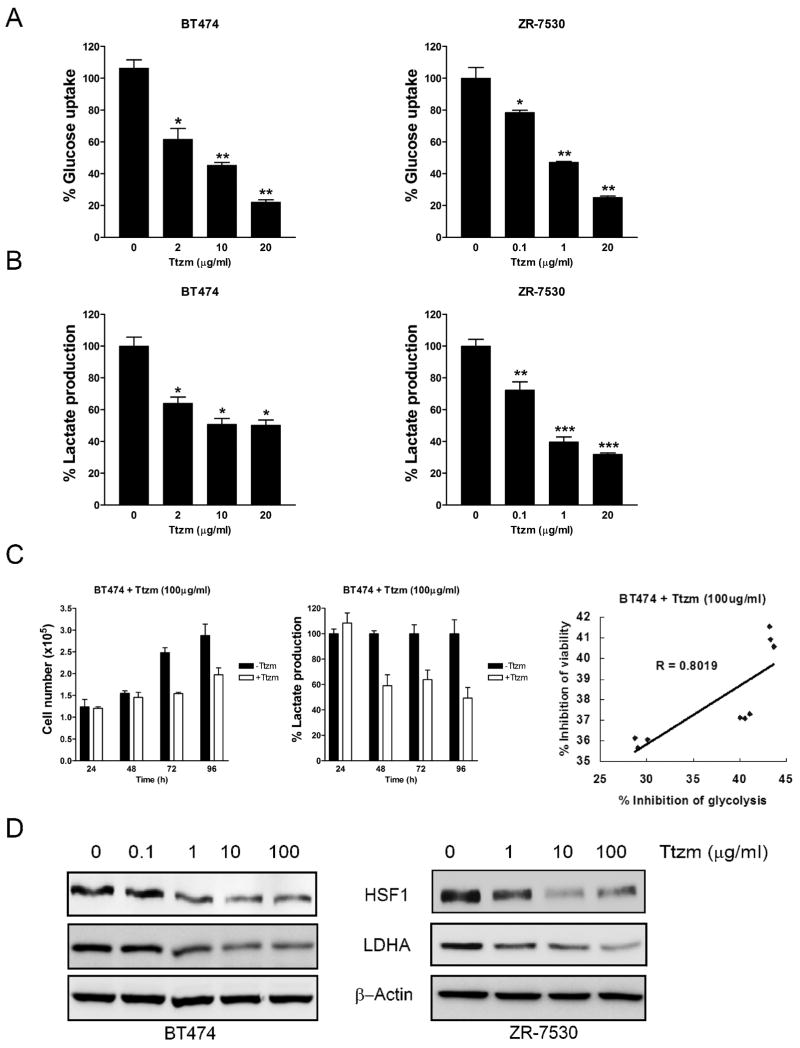
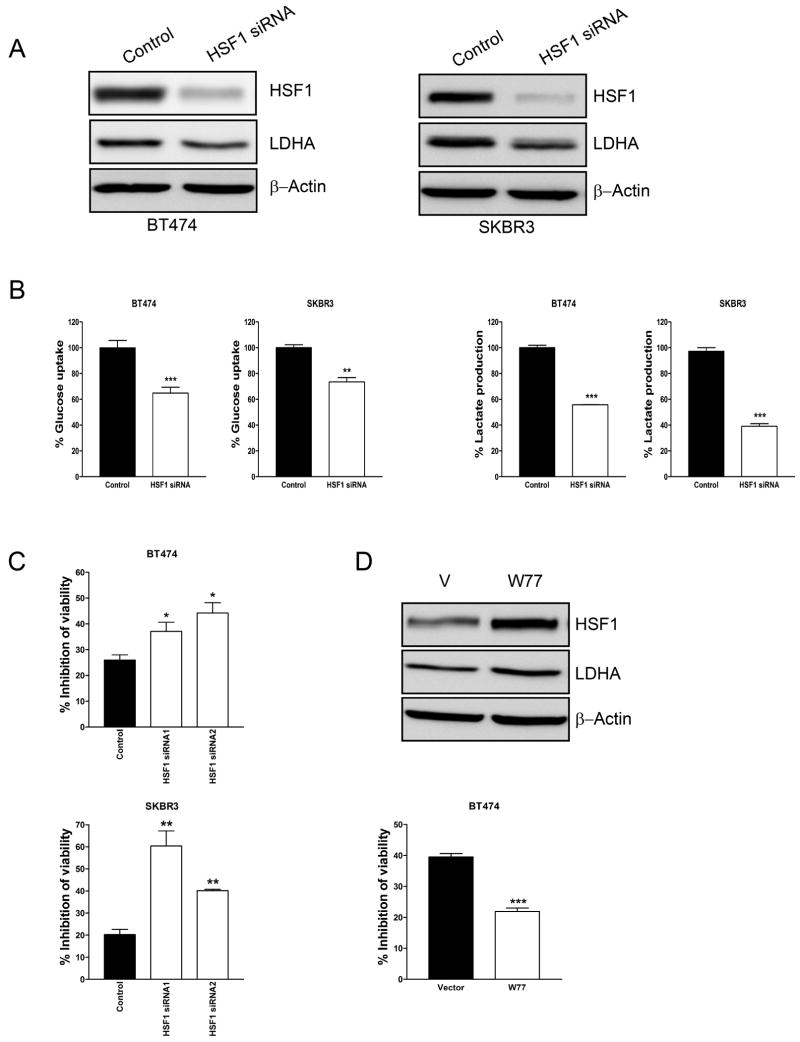
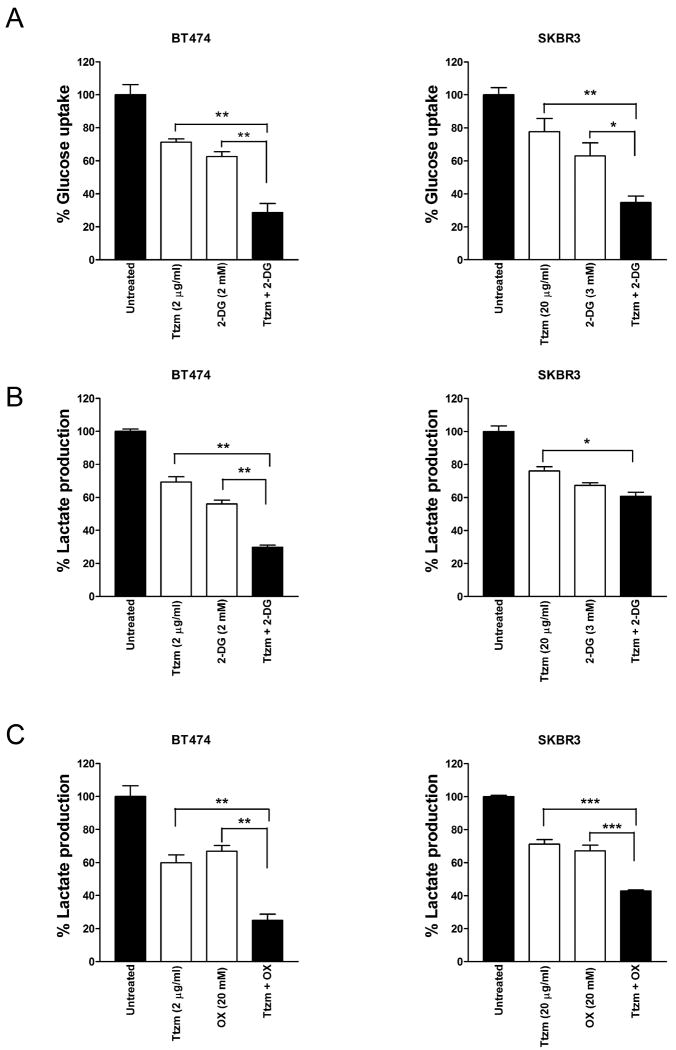
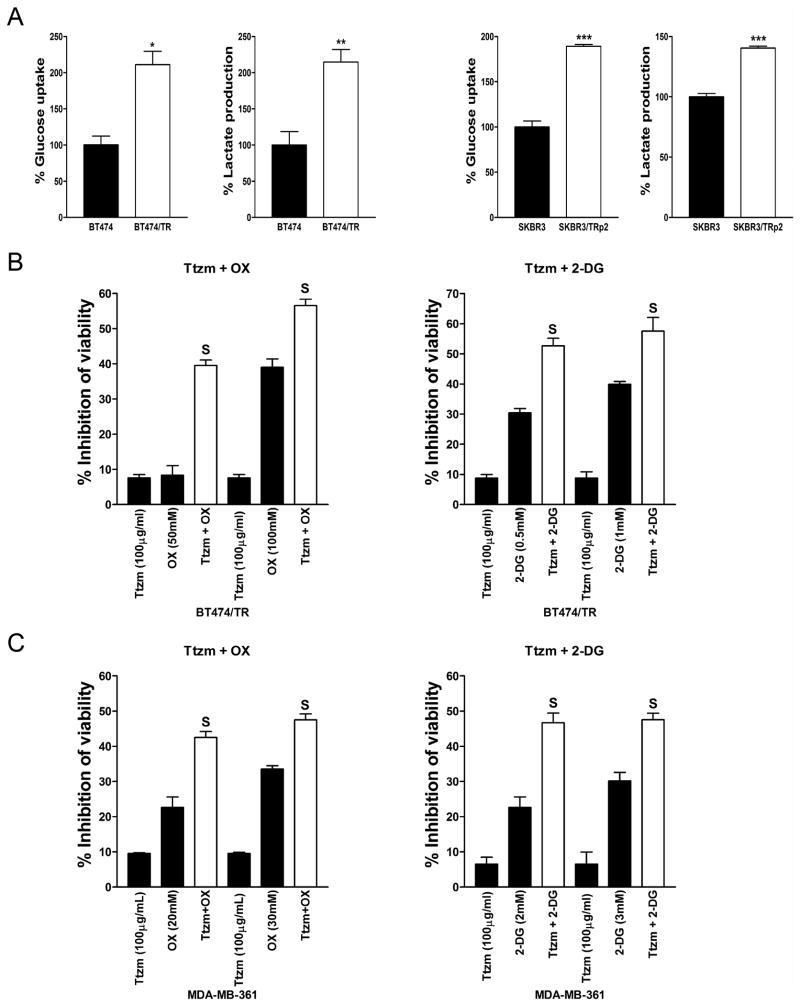
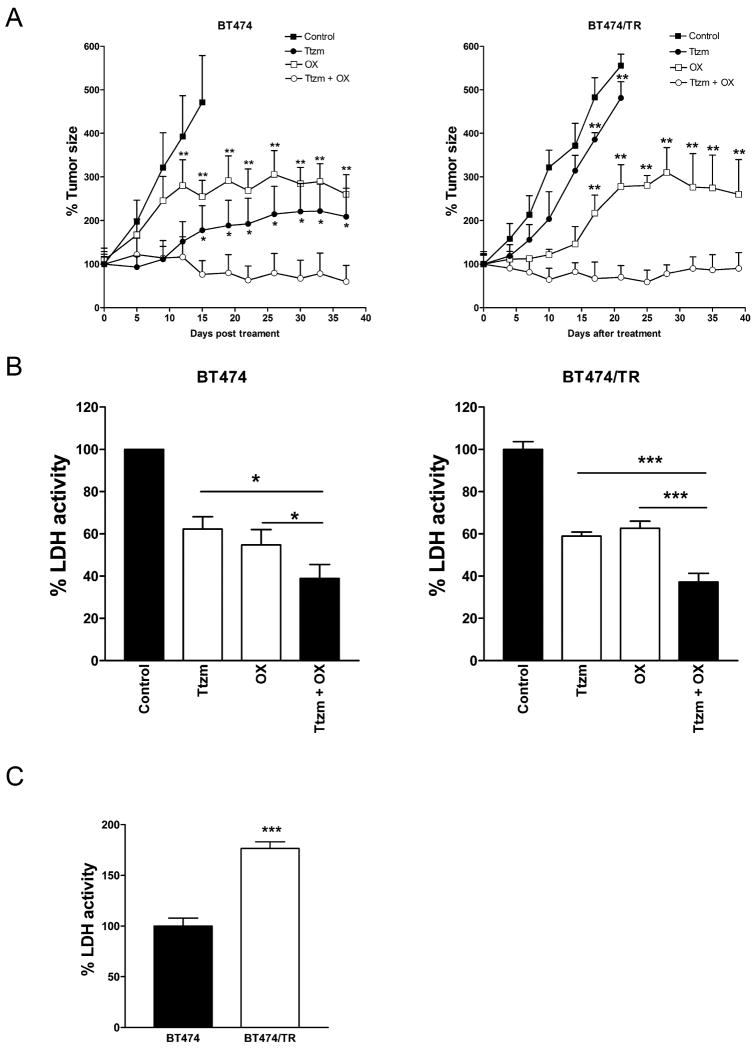
Trastuzumab shows remarkable efficacy in treatment of ErbB2-positive breast cancers when used alone or in combination with other chemotherapeutics. However, acquired resistance develops in most treated patients, necessitating alternate treatment strategies. Increased aerobic glycolysis is a hallmark of cancer and inhibition of glycolysis may offer a promising strategy to preferentially kill cancer cells. In this study, we investigated the antitumor effects of trastuzumab in combination with glycolysis inhibitors in ErbB2-positive breast cancer. We found that trastuzumab inhibits glycolysis via downregulation of heat shock factor 1 (HSF1) and lactate dehydrogenase A (LDH-A) in ErbB2-positive cancer cells, resulting in tumor growth inhibition. Moreover, increased glycolysis via HSF1 and LDH-A contributes to trastuzumab resistance. Importantly, we found that combining trastuzumab with glycolysis inhibition synergistically inhibited trastuzumab-sensitive and -resistant breast cancers in vitro and in vivo, due to more efficient inhibition of glycolysis. Taken together, our findings show how glycolysis inhibition can dramatically enhance the therapeutic efficacy of trastuzumab in ErbB2-positive breast cancers, potentially useful as a strategy to overcome trastuzumab resistance.


Figures

Figure 1
Figure 1
The combination of trastuzumab and glycolysis inhibitors synergistically inhibits cancer cell growth. A, BT474, B, ZR-7530 and C, SKBR3 cells were seeded in 96-well plates at 5 × 10³ cells/well. After 24 hrs, cells were treated with the indicated concentration of trastuzumab (Ttzm), 2-deoxyglucose (2-DG), oxamate (OX), or Ttzm plus 2-DG (left)/OX (right) and incubated for 48 hrs, and cell viability was determined. Data are presented as the percentage of viability inhibition measured in cells not treated with Ttzm and 2-DG/OX. Columns, mean of three independent experiments; bars, SE. S, synergy (CI< 1.0).
Figure 2
Figure 2
Trastuzumab inhibits glycolysis in human breast cancer cells. A, The human breast cancer cells BT474 (left) and ZR-7530 (right) were seeded in 12-well plates at 3 × 10⁵ cells/well. After 24 hrs, cells were treated with the indicated concentrations of Ttzm for 48 hrs, and glucose uptake was measured. Data are presented as the percentage of glucose uptake measured in cells not treated with Ttzm. B, BT474 (left) and ZR-7530 (right) cells were treated as described in panel (A) and lactate production was measured. Data are presented as the percentage of lactate production measured in cells not treated with Ttzm. C, BT474 cells were seeded in 12-well plates at 1 × 10⁵ cells/well. After 24 hrs, cells were treated with 100 μg/ml of Ttzm for 24, 48, 72 and 96 hrs. At different time points, cell viability was measured by direct cell counting (left) and lactate production in the medium was measured (middle). Data are presented as the percentage of lactate production measured in cells not treated with Ttzm. Columns, mean of three independent experiments; bars, SE. *, P<0.05, **, P<0.01, ***, P<0.001. Correlation scatter plot of inhibition of glycolysis (lactate production) and inhibition of viability in BT474 cells (R=0.8019, right). D, BT474 (left) and ZR-7530 (right) cells were seeded in 6-well plates at 3 × 10⁵ cells/well. After 24 hrs, cells were treated with the indicated concentrations of Ttzm for 48 hrs. The cell lysates were prepared and Western blot analyses were carried out with antibodies against HSF1, LDH-A and β-Actin.
Figure 3
Figure 3
Inhibition of HSF1 sensitizes breast cancer cells to trastuzumab. A, BT474 (left) and SKBR3 (right) cells were transfected with scramble siRNA (Control) or HSF1 siRNA. 48 hrs after siRNA transfection, cell lysates were prepared and immunoblot analyses were carried out with antibodies against HSF1, LDH-A and β-Actin. B, 24 hrs after siRNA transfection, cells were transferred to 24-well plates for glucose uptake (left) and lactate production (right) assays. Data are shown as a percentage relative to control-transfected cells. C, BT474 (upper) and SKBR3 (lower) cells were transfected with scramble siRNA (Control) or two HSF1 siRNAs (HSF1 siRNA1 or HSF1 siRNA2). 24 hrs after siRNA transfection, cells were transferred to 96-well plates. The next day, cells were treated with 100 μg/ml of Ttzm for 72 hrs, and cell viability was determined. Data are presented as the percentage of viability inhibition measured in cells not treated with Ttzm. D, Western blot with anti-HSF1 and anti-LDHA antibody of total cell extracts from stable HSF1-overexpressing BT474 cell lines W77 (V: vector). β-actin was used a loading control (upper). HSF1-overexpressing cells (W77) were seeded in 96-well plates at 5 × 10³ cells/well. The next day, cells were treated with 100 μg/ml trastuzumab for 72 hrs and cell viability was detected. Data are presented as the percentage of viability inhibition measured in cells treated without Ttzm. Columns, mean of three independent experiments; bars, SE. *, P<0.05, **, P<0.01, ***, P<0.001.
Figure 4
Figure 4
The combination of trastuzumab and glycolysis inhibitors better inhibit glycolysis in cancer cells. A, BT474 (left) and SKBR3 (right) cells were seeded in 12-well plates at 3 × 10⁵ or 1 × 10⁵ cells/well, respectively. After 24 hrs, cells were treated with the indicated concentration of Ttzm, 2-DG, or Ttzm plus 2-DG and incubated for 48 hours, and glucose uptake in the medium was measured. Data are presented as the percentage of glucose uptake measured in cells not treated with Ttzm and 2-DG. B, BT474 cells (left) and SKBR3 (right) were treated as described under Panel (a) and lactate production in the medium was measured. Data are presented as the percentage of lactate production measured in cells not treated with Ttzm and 2-DG. C, BT474 (left) and SKBR3 (right) cells were seeded in 12-well plates at 3 × 10⁵ or 1 × 10⁵ cells/well, respectively. After 24 hrs, cells were treated with the indicated concentration of Ttzm, OX, or Ttzm plus OX and incubated for 48 hours, and lactate production in the medium was measured. Data are presented as the percentage of lactate production measured in cells not treated with Ttzm and OX. Columns, mean of three independent experiments; bars, SE. *, P<0.05, **, P<0.01, ***, P<0.001.
Figure 5
Figure 5
The combination of trastuzumab and a glycolysis inhibitor effectively inhibits trastuzumab-resistant breast cancer cells. A, BT474, trastuzumab-resistant BT474/TR (left), SKBR3 and trastuzumab-resistant SKBR3/TRp2 cells (right) were seeded in 12-well plates at 2 × 10⁵ cells/well. After 48 hrs, the medium was collected and glucose uptake and lactate production were measured. Data are shown as a percentage relative to BT474 (left) or SKBR3 (right). B, BT474/TR cells were seeded in 96-well plates at 5 × 10³ cells/well. After 24 hr, cells were treated with the indicated concentration of Ttzm, 2-DG/OX, or Ttzm plus 2-DG/OX and incubated for 48 hrs, and cell viability was determined. Data are presented as the percentage of viability inhibition measured in cells not treated with Ttzm and 2-DG/OX. C, MDA-MB-361 cells were seeded and treated as described in B. Columns, mean of three independent experiments; bars, SE. S, synergy.
Figure 6
Figure 6
The combination of trastuzumab and oxamate effectively inhibits tumor growth in vivo. A, Pre-established BT474 (left) or BT474/TR (right) tumor xenografts were treated with Control (PBS), Ttzm (10mg/kg, i.p., 2×/wk × 3 wks), OX (750mg/kg, i.p., daily × 21 days), or a combination of the agents. Data are presented as the relative tumor size. Statistical analysis of the differences of average tumor sizes in the single treatment group and the combination group was performed using the unpaired Student's t test. *, P<0.05, **, P<0.01. B, Tumors derived from BT474 cells (left) or BT474/TR cells (right) were lysed for LDH activity assay. Data are presented as the percentage of LDH activity measured in the control group. C, LDH activity in tumors derived from BT474 or BT474/TR cells. Data are shown as a percentage relative to BT474 cells-formed tumors. Columns, mean of three independent tumors; bars, SE. *, P<0.05, ***, P<0.001.

References

    1. Hudis CA. Trastuzumab--mechanism of action and use in clinical practice. N Engl J Med. 2007;357:39–51. - PubMed
    1. Zhang H, Berezov A, Wang Q, Zhang G, Drebin J, Murali R, et al. ErbB receptors: from oncogenes to targeted cancer therapies. J Clin Invest. 2007;117:2051–8. - PMC - PubMed
    1. Esteva FJ, Valero V, Booser D, Guerra LT, Murray JL, Pusztai L, et al. Phase II study of weekly docetaxel and trastuzumab for patients with HER-2-overexpressing metastatic breast cancer. J Clin Oncol. 2002;20:1800–8. - PubMed
    1. Slamon DJ, Leyland-Jones B, Shak S, Fuchs H, Paton V, Bajamonde A, et al. Use of chemotherapy plus a monoclonal antibody against HER2 for metastatic breast cancer that overexpresses HER2. N Engl J Med. 2001;344:783–92. - PubMed
    1. Nagata Y, Lan KH, Zhou X, Tan M, Esteva FJ, Sahin AA, et al. PTEN activation contributes to tumor inhibition by trastuzumab, and loss of PTEN predicts trastuzumab resistance in patients. Cancer Cell. 2004;6:117–27. - PubMed

Publication types

MeSH terms