. 2011 Apr;23(4):1322-36.
doi: 10.1105/tpc.111.084020. Epub 2011 Apr 15.

Mobile gibberellin directly stimulates Arabidopsis hypocotyl xylem expansion

Affiliations

Mobile gibberellin directly stimulates Arabidopsis hypocotyl xylem expansion

Laura Ragni et al. Plant Cell. 2011 Apr.

Abstract

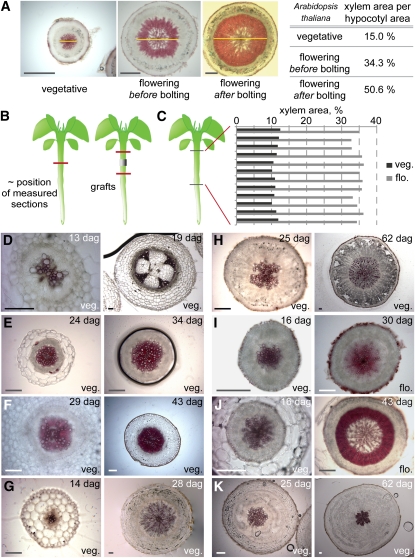
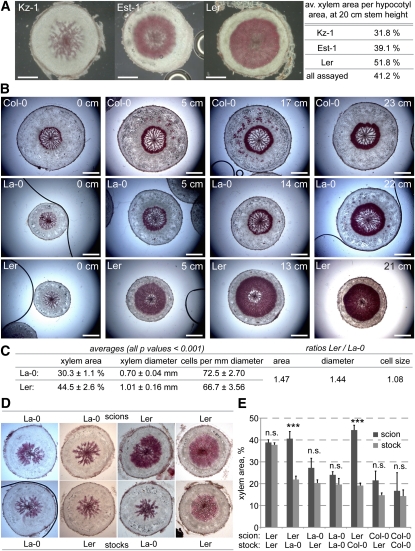
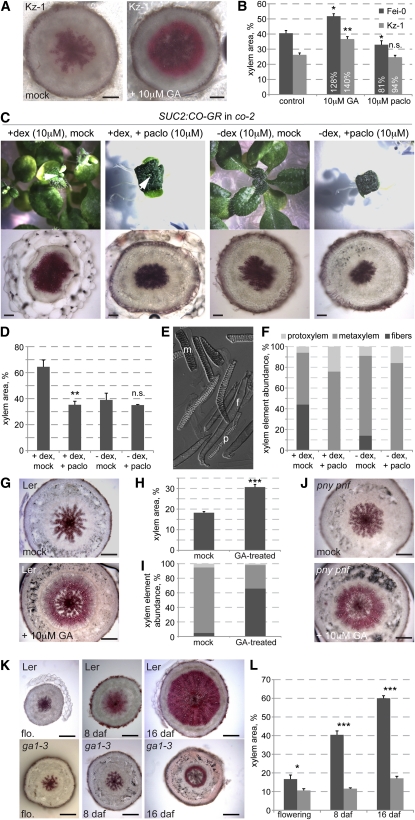
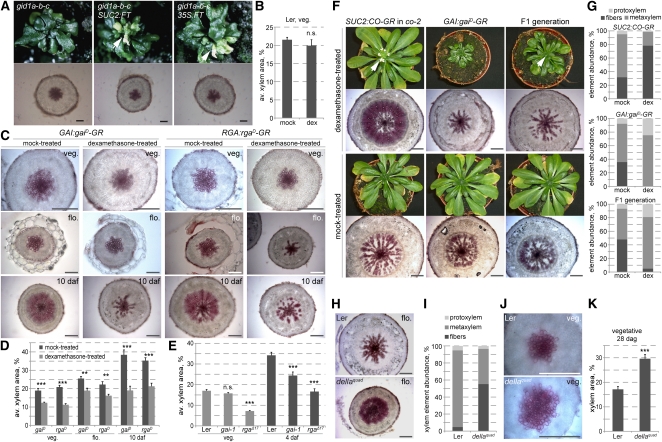
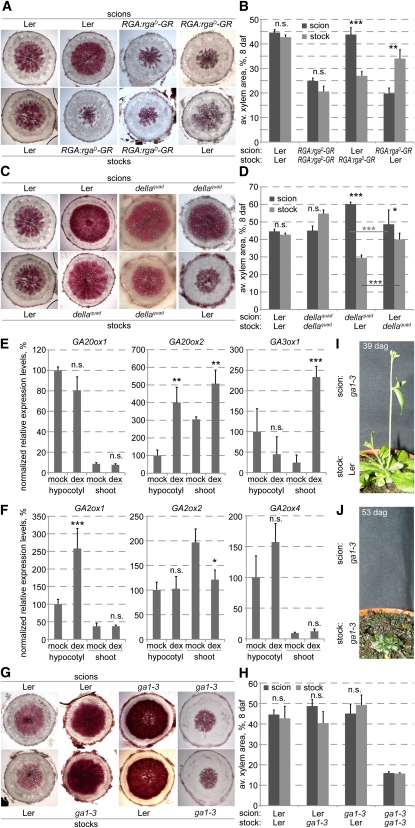
Secondary growth of the vasculature results in the thickening of plant structures and continuously produces xylem tissue, the major biological carbon sink. Little is known about the developmental control of this quantitative trait, which displays two distinct phases in Arabidopsis thaliana hypocotyls. The later phase of accelerated xylem expansion resembles the secondary growth of trees and is triggered upon flowering by an unknown, shoot-derived signal. We found that flowering-dependent hypocotyl xylem expansion is a general feature of herbaceous plants with a rosette growth habit. Flowering induction is sufficient to trigger xylem expansion in Arabidopsis. By contrast, neither flower formation nor elongation of the main inflorescence is required. Xylem expansion also does not depend on any particular flowering time pathway or absolute age. Through analyses of natural genetic variation, we found that ERECTA acts locally to restrict xylem expansion downstream of the gibberellin (GA) pathway. Investigations of mutant and transgenic plants indicate that GA and its signaling pathway are both necessary and sufficient to directly trigger enhanced xylogenesis. Impaired GA signaling did not affect xylem expansion systemically, suggesting that it acts downstream of the mobile cue. By contrast, the GA effect was graft transmissible, suggesting that GA itself is the mobile shoot-derived signal.


Figures

Figure 1.
Figure 1.
Flowering as a Condition for Hypocotyl Xylem Expansion in Plants with Rosette Growth Habit. (A) Progression of xylem expansion in Arabidopsis illustrated by transverse sections, stained for lignin with phloroglucinol to highlight xylem vessels and fibers (yellow line indicates xylem diameter). Xylem area compared with total hypocotyl area increases slowly during the vegetative phase but accelerates considerably once flowering occurs. (B) Schematic illustration of the approximate position of sections (red lines) sampled to measure the relative xylem area in the genotypes analyzed in this study. Sections were taken from the hypocotyl center, except in the case of grafting experiments. For the latter, scion and stock sections were taken about halfway between the apical and basal ends of the hypocotyls, respectively, and the silicon tubing collar of the grafts. (C) Relative xylem area as determined from serial sections along individual Arabidopsis hypocotyls before and after flowering. (D) to (K) Hypocotyl cross sections of species with nonrosette growth habit (i.e., the stem internodes elongate already during vegetative growth) ([D] to [G]) and with rosette growth habit (i.e., the stem internodes elongate only once flowering has been induced) ([H] to [K]), demonstrating that in nonrosette plants, xylem expansion already starts during vegetative growth. S. lycopersicum (D), A. alpina (E), Aster alpinus (F), N. benthamiana (G), B. verna (H), Arabidopsis (I), C. hirsute (J), T. officinalis (K). dag, days after germination; veg., vegetative growth phase; flo., flowering, at appearance of inflorescence meristem. Bars = 200 μm.
Figure 2.
Figure 2.
ER Is a Negative Regulator of Hypocotyl Xylem Expansion. (A) Natural quantitative variation in hypocotyl xylem expansion between Arabidopsis accessions, exemplified as xylem area per total transverse hypocotyl area in plants with 20-cm-tall main inflorescence stems. Est-1, Estland-1. (B) Progression of hypocotyl xylem expansion in the Col-0 reference strain and the er mutant (Ler) in La-0 background. Plants with roughly equal stem height are shown for comparison; 0-cm stem height represents flowering (i.e., appearance of inflorescence meristem). (C) Quantification of Ler and La-0 xylem expansion traits determined 8 d after flowering. Standard errors are indicated. All differences are significant with P values < 0.001. (D) Examples of scion and stock hypocotyl sections from micrograftings of indicated genotypes, sampled at 8 d after flowering. (E) Xylem area quantification of scion and stock hypocotyls obtained from indicated micrograftings, sampled at 8 d after flowering. Error bars are standard error. n.s., not significant; *P < 0.05; **P < 0.01; ***P < 0.001. Bars = 200 μm.
Figure 3.
Figure 3.
GA Is Necessary for Hypocotyl Xylem Expansion. (A) Rescue of the reduced xylem expansion phenotype of the Kz-1 accession (assayed at 26 d after germination) by treatment with 10 μM GA. (B) Quantification of xylem expansion in Kz-1 (assayed at 29 d after germination) and an average accession, Fei-0 (St. Maria d. Feiria) (assayed at 34 d after germination) with or without GA treatment. (C) Suppression of hypocotyl xylem expansion in SUC2:CO-GR transgenic plants (co-2 mutant background) upon interference with GA biosynthesis by treatment with the inhibitor paclobutrazol (paclo). Plants were first treated with dexamethasone (dex) from 0 to 5 d after germination to induce flowering and thereby xylem expansion. This was followed by a 14-d treatment with paclobutrazol, inducing a GA-deficient phenotype (top). Induced plants flowered at 19 d after germination, and hypocotyls were sampled and sectioned at that point (bottom). Arrowheads point out the inflorescence meristem in dexamethasone-induced plants. (D) Quantification of xylem area in the experiment illustrated by examples in (C). Error bars are se. (E) Example of xylem elements released from a hypocotyl sample by maceration. Elements can be distinguished by their morphology and counted to determine relative abundance. f, fiber; m, metaxylem; p, protoxylem. (F) Quantification of xylem element abundance in the experiment illustrated by examples in (C). (G) Stimulation of xylem expansion in the Ler accession by GA treatment, sampled at vegetative state. (H) Quantification of xylem area in the experiment illustrated by examples in (G). Error bars are se. (I) Quantification of xylem element abundance in the experiment illustrated by examples in (G). See (F) for xylem element coding. (J) Stimulation of xylem expansion in the pny pnf double mutant by GA treatment, sampled at vegetative state. (K) Reduction of xylem expansion in the GA-biosynthetic mutant ga1-3 compared with its background, Ler. (L) Quantification of xylem area in the experiment illustrated by examples in (K). Error bars are se. daf, days after flowering; n.s., not significant; *P < 0.05; **P < 0.01; ***P < 0.001. Bars = 200 μm.
Figure 4.
Figure 4.
Control of Hypocotyl Xylem Expansion by GA Signaling. (A) gid1a-b-c triple mutants that fail to flower (top) unless transgenes driving constitutive expression of the florigen, FT, are introduced. Transverse hypocotyl sections (bottom) were taken at 14 days after flowering of the transgenic lines for all lines. Arrowheads point out the inflorescence meristem and flower-like structures in transgenic plants. (B) Control experiment demonstrating the absence of dexamethasone (dex) effects on xylem expansion in the Ler control background. (C) Suppression of xylem expansion by dex activation of dominant-negative versions of transgenic GAI and RGA genes (gaiD and rgaD) fused with the glucocorticoid receptor domain (GR). (D) Quantification of xylem area in the experiments illustrated in (C). Error bars are se. (E) Reduced xylem expansion in the rgaΔ17 and the gai-1 mutants compared with their Ler background at vegetative state and after flowering. Error bars are se. (F) Suppression of xylem expansion by dex activation of dominant-negative transgenic GAI and simultaneous dex induction of flowering and, thus, xylem expansion through the SUC2:CO-GR transgene. Arrowheads point out the inflorescence meristems. (G) Quantification of xylem element abundance in the hypocotyls sampled in the experiment illustrated in (F). (H) Enhanced xylem expansion at flowering in the rga-24 gai-t6 rgl1-1 rgl2-1 quadruple loss-of-function mutant (dellaquad) compared with its Ler background (dellaquad at 36 d after germination; Ler at 42 d after germination). (I) Quantification of xylem element abundance in the hypocotyls sampled in the experiment illustrated in (H). (J) Xylem expansion in hypocotyls of Ler and dellaquad plants at same age vegetative state (28 d after germination). (K) Quantification of xylem area in the experiment illustrated by examples in (J). Error bars are se. daf, days after flowering; n.s., not significant; *P < 0.05; **P < 0.01; ***P < 0.001. Bars = 200 μm.
Figure 5.
Figure 5.
Evidence for GA as the Mobile Shoot-Derived Signal That Triggers Hypocotyl Xylem Expansion upon Flowering. (A) Examples of scion and stock hypocotyl sections from micrograftings of indicated genotypes, sampled at 8 d after flowering. (B) Xylem area quantification of scion and stock hypocotyls obtained from indicated micrograftings, sampled at 8 d after flowering. Error bars are se. (C) Examples of scion and stock hypocotyl sections from micrograftings of indicated genotypes, sampled at 8 d after flowering. (D) Xylem area quantification of scion and stock hypocotyls obtained from indicated micrograftings, sampled at 8 d after flowering. Error bars are se. (E) Expression level quantifications of GA biosynthetic genes in SUC2:CO-GR transgenic plants (co-2 mutant background), comparing hypocotyls and shoots of 9-d-old mock-treated samples and samples treated with dexamethasone (dex) from 6 to 8 d after germination to induce flowering and thereby xylem expansion. Averaged relative expression levels normalized with respect to the EF1 housekeeping gene are indicated. Expression was quantified for all genes in each of three replicates; measurements represent the average of the relative expression with respect to EF1 from each sample. Error bars are se. (F) Same experiment as (E), for GA catabolic genes. Error bars are se. (G) Examples of scion and stock hypocotyl sections from micrograftings of indicated genotypes, sampled at 8 d after flowering. (H) Xylem area quantification of scion and stock hypocotyls obtained from indicated micrograftings, sampled at 8 d after flowering. Error bars are se. (I) Development of a ga1-3 shoot scion grafted onto a Ler root stock. (J) Development of a ga1-3 shoot scion grafted onto a ga1-3 root stock. n.s., not significant; *P < 0.05; **P < 0.01; ***P < 0.001.

References

    1. Achard P., Cheng H., De Grauwe L., Decat J., Schoutteten H., Moritz T., Van Der Straeten D., Peng J., Harberd N.P. (2006). Integration of plant responses to environmentally activated phytohormonal signals. Science 311: 91–94 - PubMed
    1. Aukerman M.J., Sakai H. (2003). Regulation of flowering time and floral organ identity by a MicroRNA and its APETALA2-like target genes. Plant Cell 15: 2730–2741 - PMC - PubMed
    1. Berleth T., Mattsson J., Hardtke C.S. (2000). Vascular continuity and auxin signals. Trends Plant Sci. 5: 387–393 - PubMed
    1. Biemelt S., Tschiersch H., Sonnewald U. (2004). Impact of altered gibberellin metabolism on biomass accumulation, lignin biosynthesis, and photosynthesis in transgenic tobacco plants. Plant Physiol. 135: 254–265 - PMC - PubMed
    1. Björklund S., Antti H., Uddestrand I., Moritz T., Sundberg B. (2007). Cross-talk between gibberellin and auxin in development of Populus wood: Gibberellin stimulates polar auxin transport and has a common transcriptome with auxin. Plant J. 52: 499–511 - PubMed

Publication types

MeSH terms