. 2011 May 18;30(10):2071-82.
doi: 10.1038/emboj.2011.111. Epub 2011 Apr 15.

NFIL3/E4BP4 controls type 2 T helper cell cytokine expression

Affiliations

NFIL3/E4BP4 controls type 2 T helper cell cytokine expression

Masaki Kashiwada et al. EMBO J. .

Abstract

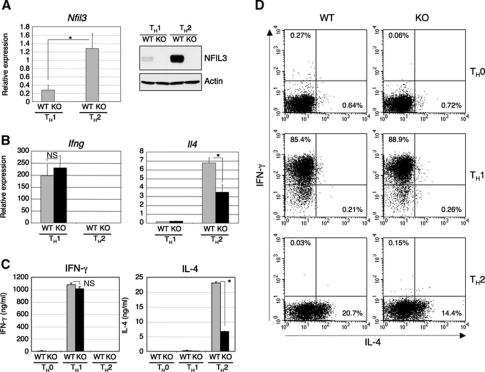
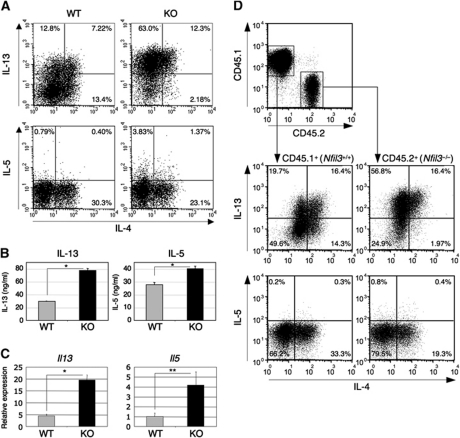
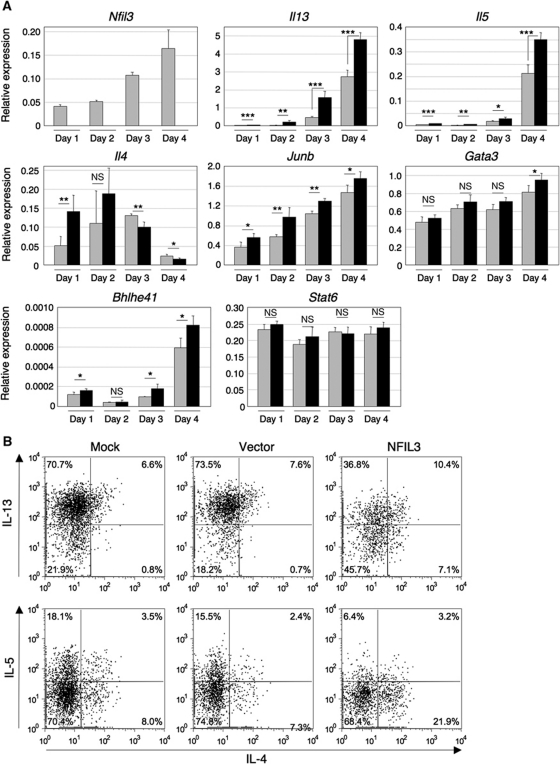
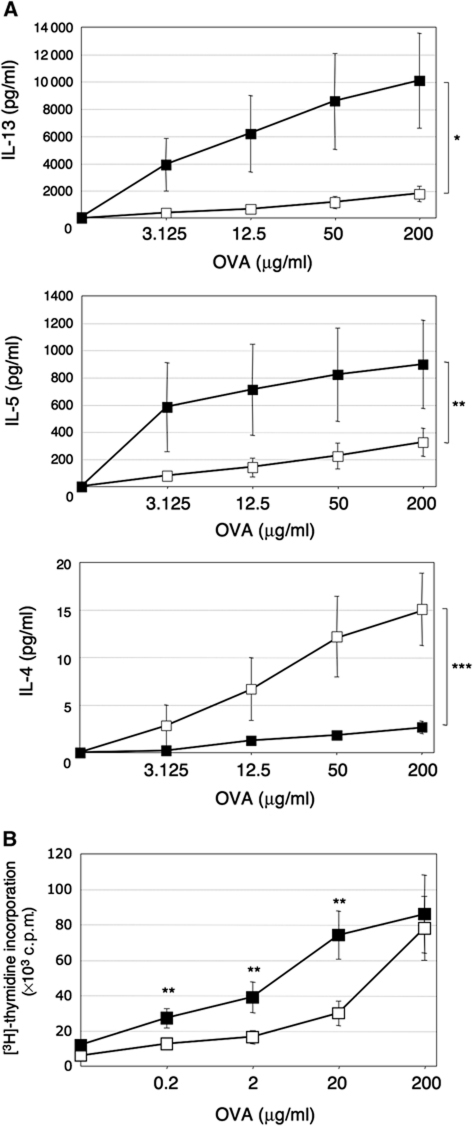
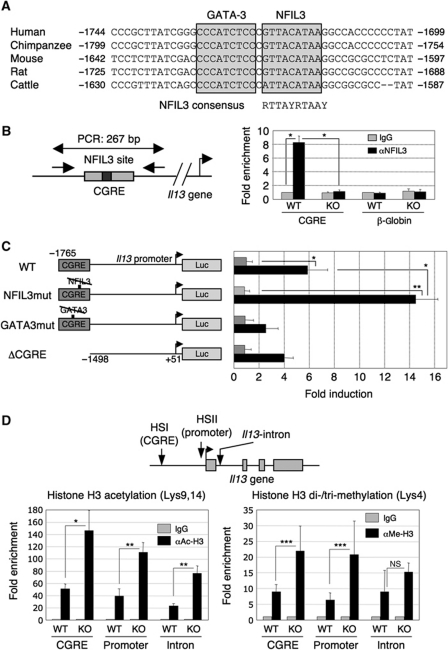
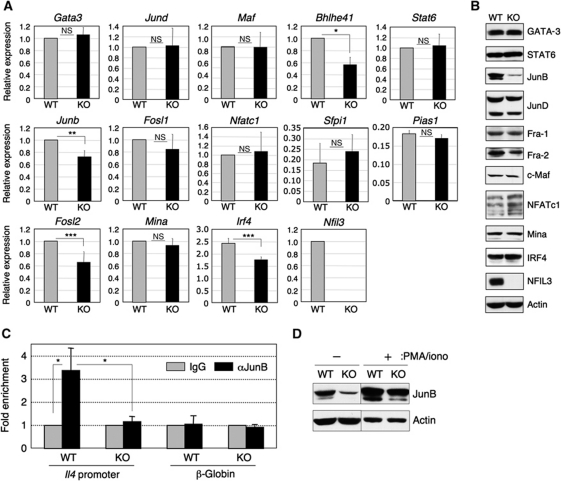
Type 2 T helper (T(H)2) cells are critical for the development of allergic immune responses; however, the molecular mechanism controlling their effector function is still largely unclear. Here, we report that the transcription factor NFIL3/E4BP4 regulates cytokine production and effector function by T(H)2 cells. NFIL3 is highly expressed in T(H)2 cells but much less in T(H)1 cells. Production of interleukin (IL)-13 and IL-5 is significantly increased in Nfil3(-/-) T(H)2 cells and is decreased by expression of NFIL3 in wild-type T(H)2 cells. NFIL3 directly binds to and negatively regulates the Il13 gene. In contrast, IL-4 production is decreased in Nfil3(-/-) T(H)2 cells. Increased IL-13 and IL-5 together with decreased IL-4 production by antigen-stimulated splenocytes from the immunized Nfil3(-/-) mice was also observed. The ability of NFIL3 to alter T(H)2 cytokine production is a T-cell intrinsic effect. Taken together, these data indicate that NFIL3 is a key regulator of T(H)2 responses.


Conflict of interest statement

The authors declare that they have no conflict of interest.

Figures

Figure 1
Figure 1
Altered IL-4-producing TH2 differentiation in the absence of NFIL3. (A) Expression of Nfil3 mRNA and NFIL3 protein in TH1 and TH2 cells differentiated in vitro. Expression of Nfil3 mRNA was determined by quantitative real-time RT–PCR and data shown are the mean and s.d. from four experiments (left, *P<0.01). Expression of NFIL3 protein was determined by western blot analysis and data are representative of four experiments with similar results (right). (B) Quantitative real-time RT–PCR analysis of Ifng and Il4 mRNA in TH1 and TH2 cells differentiated in vitro. Data show the mean and s.d. from four experiments (n.s., not significant; *P<0.001). (C) Secretion of IFN-γ and IL-4 by TH1 and TH2 cells restimulated with anti-CD3/CD28 for 24 h. Cytokine concentration was determined by ELISA and data show the mean and s.d. from four experiments (n.s., not significant; *P<0.0001). (D) Intracellular staining for IFN-γ and IL-4 of TH0, TH1, and TH2 cells differentiated in vitro. Restimulated cells were stained and analysed by flow cytometry. Data are representative of four experiments with similar results.
Figure 2
Figure 2
Altered TH2 cytokine production in Nfil3−/− TH2 cells. (A) Increased IL-13 and IL-5 production in Nfil3−/− TH2 cells. Cytokine production of TH2 cells restimulated with PMA/ionomycin was determined by intracellular staining and analysed by flow cytometry. Data are representative of four experiments with similar results. (B) Increased secretion of IL-13 and IL-5 by Nfil3−/− TH2 cells restimulated with anti-CD3/CD28 for 24 h. Cytokine concentration was determined by ELISA and data show the mean and s.d. from four experiments (*P<0.001). (C) Increased expression of Il13 and Il5 mRNA in Nfil3−/− TH2 cells. Expression of mRNA was determined by quantitative real-time RT–PCR. Data show the mean and s.d. from four experiments (*P<0.0001, **P<0.005). (D) Altered cytokine production in Nfil3−/− TH2 cells is cell intrinsic. Naive CD4+ T cells from WT mice (CD45.1+) and Nfil3−/− mice (CD45.2+) were co-cultured under TH2 conditions for 7 days and cytokine production by cells restimulated with PMA/ionomycin was determined by intracellular staining and analysed by flow cytometry. Data are representative of three experiments with similar results.
Figure 3
Figure 3
Role of NFIL3 expression at an early stage of TH2 differentiation. (A) Required expression of Nfil3 at an early stage of TH2 differentiation for the normal expression of Il13 and Il5 genes. Naive CD4+ T cells from WT (grey bar) and Nfil3−/− (closed bar) mice were cultured under TH2 conditions up to 4 days and RNA was prepared for quantitative RT–PCR. Relative expression of each gene was normalized by the expression of Hprt1 mRNA. Data show the mean and s.d. from four experiments (NS, not significant; *P<0.05, **P<0.01, ***P<0.001) (B) Introduction of NFIL3 into Nfil3−/− T cells at an early time point of TH2 differentiation restores the impairment of TH2 cytokine production. CD4+ T cells under TH2 conditions for 30 h were infected with retroviruses carrying NFIL3 or vector (pMiT). Infected cells were cultured for an additional 6 days under TH2 conditions and then restimulated with PMA/ionomycin in the presence of Brefeldin A to examine cytokine production by intracellular staining. Data are representative of three experiments with similar results.
Figure 4
Figure 4
NFIL3 regulates TH2 response in vivo. Mice (n=4 for each genotypes, WT mice: open square, Nfil3−/− mice: closed square) were immunized with OVA plus alum. After 6 days, splenocytes were prepared and cultured in the presence of OVA for 3 days. (A) Increased IL-13 and IL-5 but decreased IL-4 production in response to OVA in Nfil3−/− mice. Supernatants were harvested and secreted TH2 cytokines were examined by ELISA (*P=0.078, **P=0.16, ***P<0.05). (B) Increased OVA-specific cell proliferation in Nfil3−/− mice. Proliferation was measured during the last 16 h by measurement of thymidine incorporation in triplicate. Data show the mean and s.e. from four mice in each group and representative of two independent experiments (**P<0.05).
Figure 5
Figure 5
NFIL3 binds to CGRE and suppresses Il13 gene expression. (A) Sequence alignment around the putative NFIL3-binding site in the CGRE region. GATA-3 and NFIL3-binding sequences are boxed and the consensus NFIL3-binding sequence is shown. The numbers of positions relative to the transcriptional start site (human, mouse, and cattle) or the translational start site (chimpanzee and rat) are indicated, respectively. (B) NFIL3 binds to CGRE in vivo. The region amplified by PCR and the primers are indicated (left). Splenic CD4 T cells from WT and Nfil3−/− mice cultured under TH2 conditions for 7 days were crosslinked and soluble chromatin complexes were immunoprecipitated by anti-NFIL3 antibody or control IgG. The region including CGRE in the co-precipitated DNA was amplified by PCR. The β-globin gene was used as a negative control. The average and s.d. of enrichment from four experiments were indicated (right). *P<0.0001. (C) Negative regulation of Il13 gene transcription by NFIL3. The reporter constructs of WT, NFIL3-binding mutant, GATA-3-binding mutant, and CGRE-deletion mutant used are shown (left). The TH2 cell line, D10.G4.1, was transfected with the indicated reporter constructs and stimulated with anti-CD3/CD28 antibodies for 48 h. Cell lysates were subjected to luciferase assay. Five experiments were performed with similar results. *P<0.01, **P<0.001. (D) Chromatin modification in the Il13 gene locus. The region amplified by PCR indicated (top). Splenic CD4 T cells from WT and Nfil3−/− mice cultured under TH2 conditions for 7 days were crosslinked and soluble chromatin complexes were immunoprecipitated by anti-acetyl Histone H3, anti-di + tri-methyl Histone H3, or control IgG. The region including the CGRE, promoter region, and first intron in the co-precipitated DNA were amplified by PCR. The average and s.d. of enrichment from four experiments are indicated (*P<0.005, **P<0.001, ***P<0.05; NS, not significant).
Figure 6
Figure 6
Indirect regulation of Il4 gene expression by NFIL3. (A) Gene expression levels of transcription factors involved in the regulation of Il4 gene expression. Real-time RT–PCR analysis for the genes listed in Nfil3−/− and WT cells cultured under TH2 condition for 7 days was performed. Relative expression of each gene was normalized to the expression of Hprt1 mRNA and WT value was set as 1. Data show the mean and s.d. from four experiments (*P<0.001, **P<0.002, ***P<0.01). (B) Protein expression levels of transcription factors listed in (A). Cell lysates from the cells above were subjected to western blot analysis. At least four experiments were performed with similar results. (C) Reduced JunB binding to the Il4 promoter in Nfil3−/− TH2 cells (left). Nfil3−/− and WT TH2 cells were restimulated with PMA/ionomycin for 4 h and were crosslinked and soluble chromatin complexes were immunoprecipitated by anti-JunB antibody or control IgG. Il4 promoter region in the co-precipitated DNA were amplified by PCR. The β-globin gene was used as a negative control. The average and s.d. of enrichment from three experiments are indicated (*P<0.05). (D) Reduced JunB expression in Nfil3−/− cells both before and after PMA/ionomycin restimulation. Cells were unstimulated or stimulated with PMA/ionomycin for 4 h and prepared cell lysates for western blot analysis. Data are representative from more than five independent experiments and two independent experiments for the unstimulated and PMA/ionomycin-stimulated samples, respectively. The lanes are from the same blot.

Similar articles

Cited by

References

    1. Agarwal S, Rao A (1998) Modulation of chromatin structure regulates cytokine gene expression during T cell differentiation. Immunity 9: 765–775 - PubMed
    1. Ahyi AN, Chang HC, Dent AL, Nutt SL, Kaplan MH (2009) IFN regulatory factor 4 regulates the expression of a subset of Th2 cytokines. J Immunol 183: 1598–1606 - PMC - PubMed
    1. Akashi M, Ichise T, Mamine T, Takumi T (2006) Molecular mechanism of cell-autonomous circadian gene expression of Period2, a crucial regulator of the mammalian circadian clock. Mol Biol Cell 17: 555–565 - PMC - PubMed
    1. Altura RA, Inukai T, Ashmun RA, Zambetti GP, Roussel MF, Look AT (1998) The chimeric E2A-HLF transcription factor abrogates p53-induced apoptosis in myeloid leukemia cells. Blood 92: 1397–1405 - PubMed
    1. Ansel KM, Djuretic I, Tanasa B, Rao A (2006) Regulation of Th2 differentiation and Il4 locus accessibility. Annu Rev Immunol 24: 607–656 - PubMed

Publication types

LinkOut - more resources