

Reversible large-scale modification of cortical networks during neuroprosthetic control
- PMID: 21499255
- PMCID: PMC3389499
- DOI: 10.1038/nn.2797
Reversible large-scale modification of cortical networks during neuroprosthetic control
Abstract
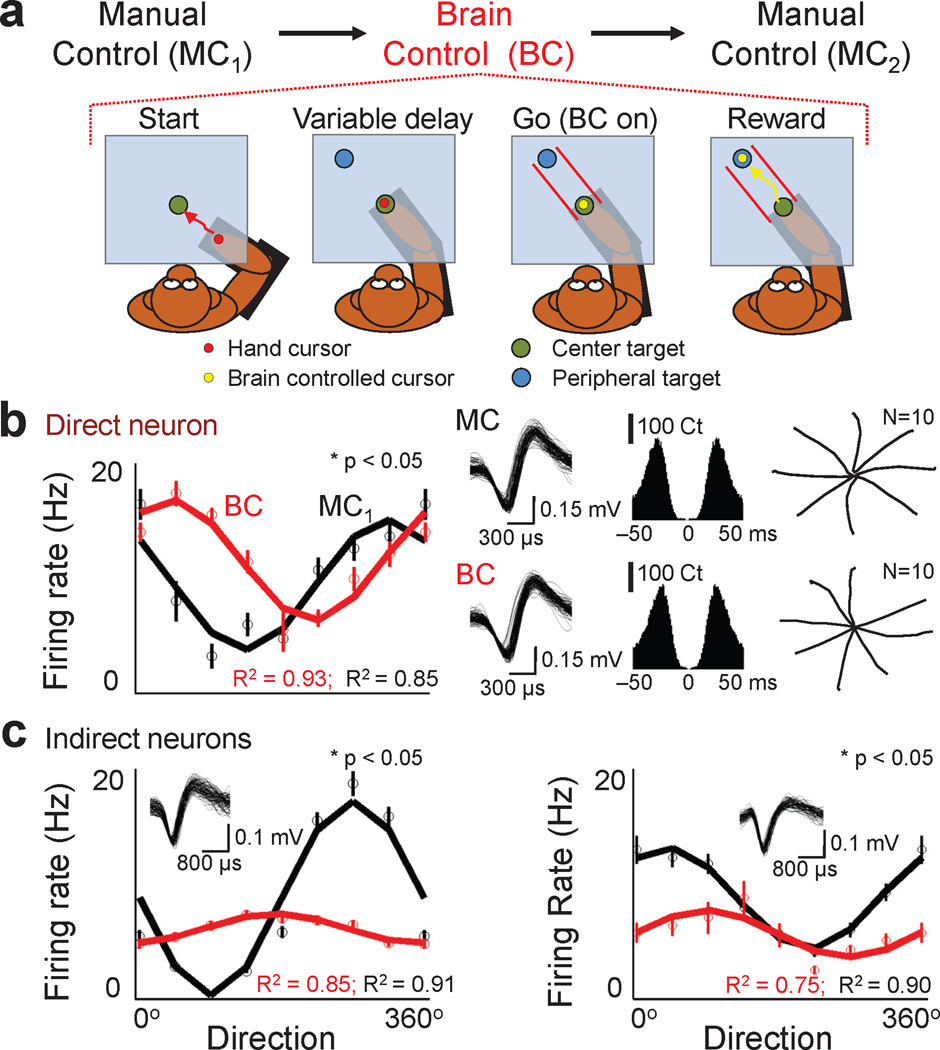
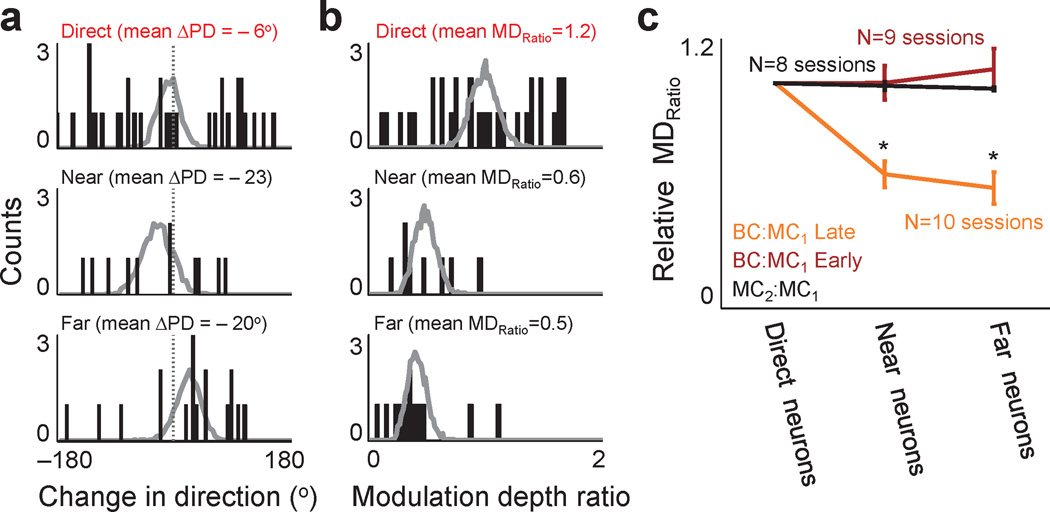
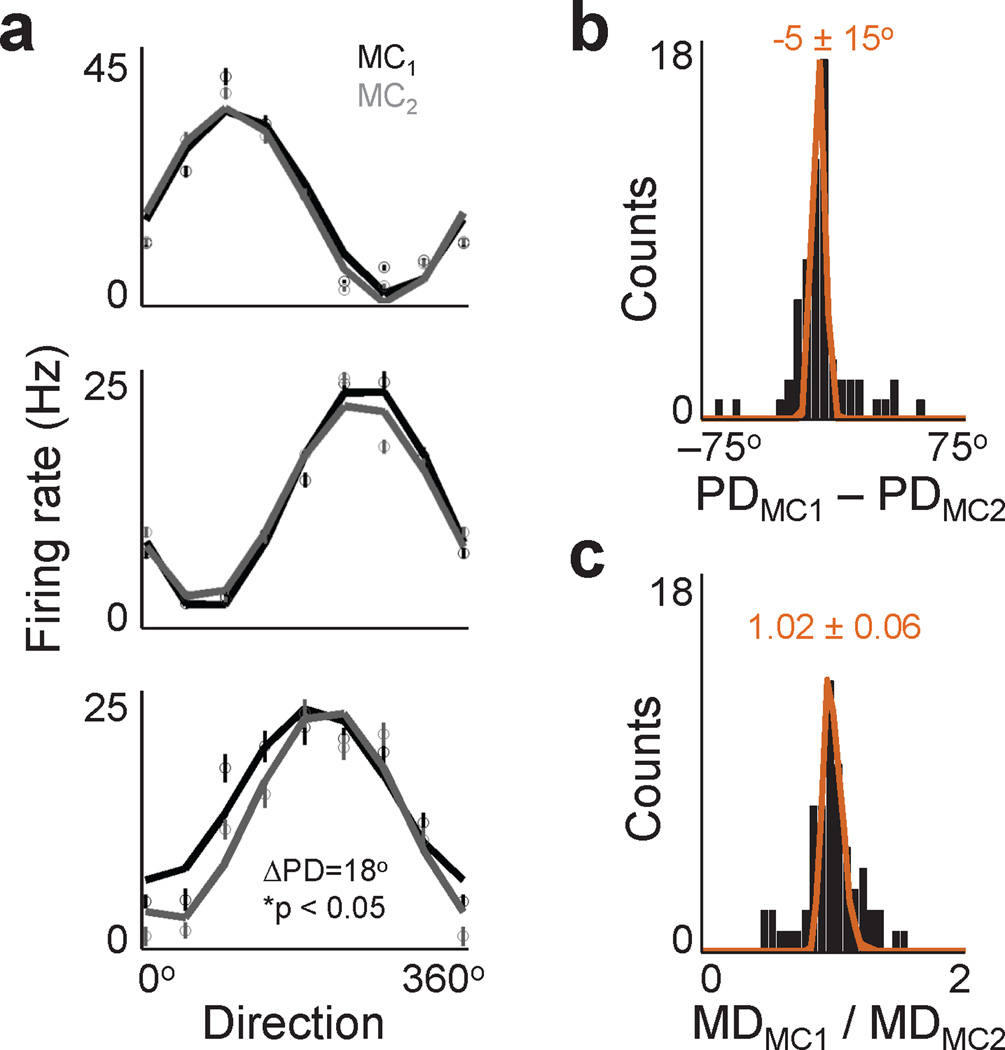
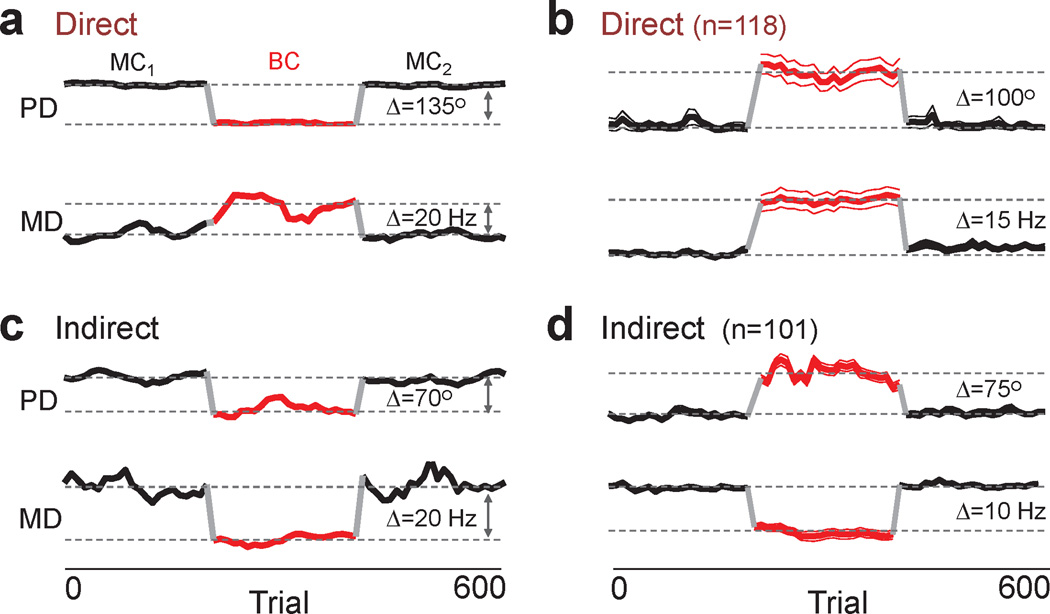
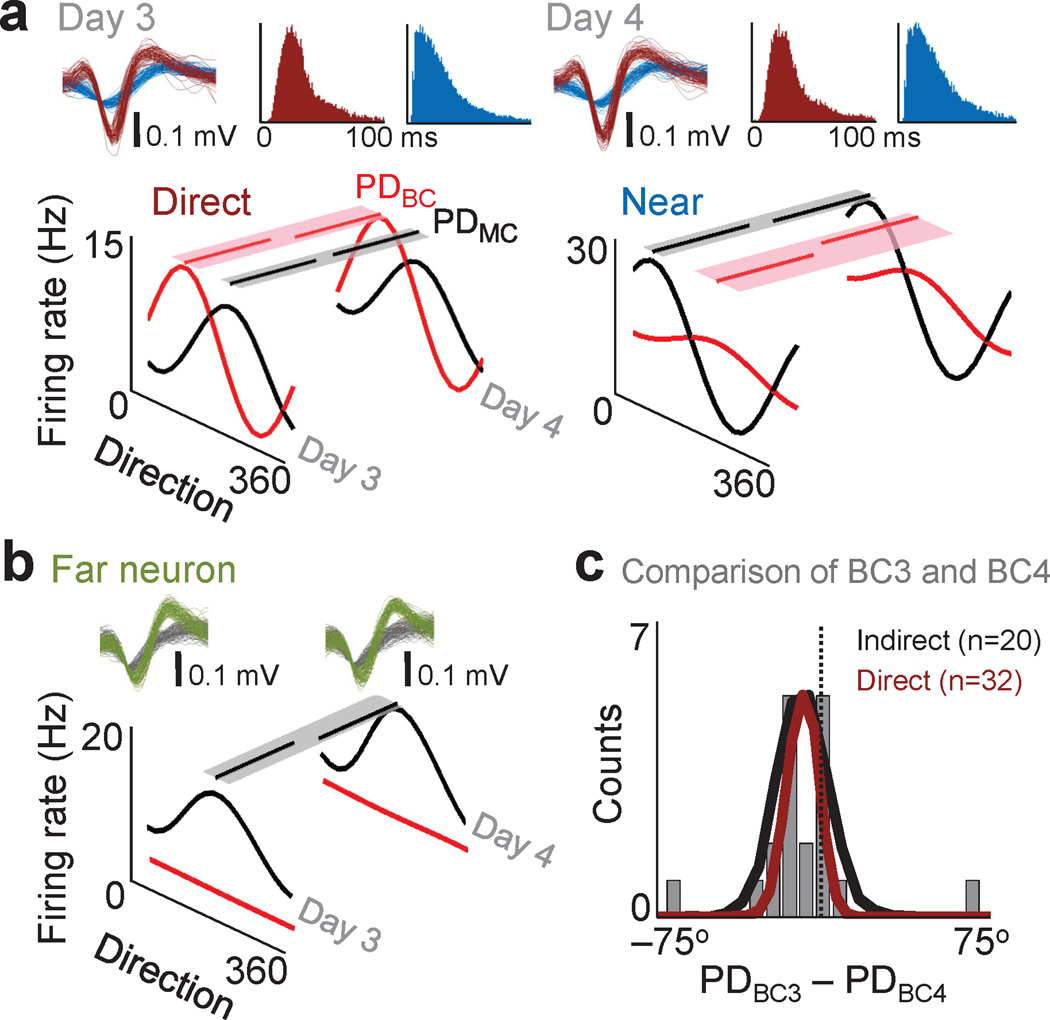
Brain-machine interfaces (BMIs) provide a framework for studying cortical dynamics and the neural correlates of learning. Neuroprosthetic control has been associated with tuning changes in specific neurons directly projecting to the BMI (hereafter referred to as direct neurons). However, little is known about the larger network dynamics. By monitoring ensembles of neurons that were either causally linked to BMI control or indirectly involved, we found that proficient neuroprosthetic control is associated with large-scale modifications to the cortical network in macaque monkeys. Specifically, there were changes in the preferred direction of both direct and indirect neurons. Notably, with learning, there was a relative decrease in the net modulation of indirect neural activity in comparison with direct activity. These widespread differential changes in the direct and indirect population activity were markedly stable from one day to the next and readily coexisted with the long-standing cortical network for upper limb control. Thus, the process of learning BMI control is associated with differential modification of neural populations based on their specific relation to movement control.
Conflict of interest statement
Figures
Similar articles
-
Redundant information encoding in primary motor cortex during natural and prosthetic motor control.J Comput Neurosci. 2012 Jun;32(3):555-61. doi: 10.1007/s10827-011-0369-1. Epub 2011 Nov 1. J Comput Neurosci. 2012. PMID: 22042443
-
Selective modulation of cortical population dynamics during neuroprosthetic skill learning.Sci Rep. 2022 Sep 24;12(1):15948. doi: 10.1038/s41598-022-20218-3. Sci Rep. 2022. PMID: 36153356 Free PMC article.
-
Selection and parameterization of cortical neurons for neuroprosthetic control.J Neural Eng. 2006 Jun;3(2):162-71. doi: 10.1088/1741-2560/3/2/010. Epub 2006 May 16. J Neural Eng. 2006. PMID: 16705272
-
The neural basis of perceptual learning.Neuron. 2001 Sep 13;31(5):681-97. doi: 10.1016/s0896-6273(01)00424-x. Neuron. 2001. PMID: 11567610 Review.
-
A review on directional information in neural signals for brain-machine interfaces.J Physiol Paris. 2009 Sep-Dec;103(3-5):244-54. doi: 10.1016/j.jphysparis.2009.08.007. Epub 2009 Aug 7. J Physiol Paris. 2009. PMID: 19665554 Review.
Cited by
-
Volitional Generation of Reproducible, Efficient Temporal Patterns.Brain Sci. 2022 Sep 20;12(10):1269. doi: 10.3390/brainsci12101269. Brain Sci. 2022. PMID: 36291203 Free PMC article.
-
Single-trial cross-area neural population dynamics during long-term skill learning.Nat Commun. 2020 Aug 13;11(1):4057. doi: 10.1038/s41467-020-17902-1. Nat Commun. 2020. PMID: 32792523 Free PMC article.
-
Real-Time Neurofeedback to Modulate β-Band Power in the Subthalamic Nucleus in Parkinson's Disease Patients.eNeuro. 2018 Dec 21;5(6):ENEURO.0246-18.2018. doi: 10.1523/ENEURO.0246-18.2018. eCollection 2018 Nov-Dec. eNeuro. 2018. PMID: 30627648 Free PMC article.
-
Noninvasively recorded high-gamma signals improve synchrony of force feedback in a novel neurorehabilitation brain-machine interface for brain injury.J Neural Eng. 2022 Jun 1;19(3):10.1088/1741-2552/ac7004. doi: 10.1088/1741-2552/ac7004. J Neural Eng. 2022. PMID: 35576911 Free PMC article.
-
Volitional enhancement of firing synchrony and oscillation by neuronal operant conditioning: interaction with neurorehabilitation and brain-machine interface.Front Syst Neurosci. 2014 Feb 6;8:11. doi: 10.3389/fnsys.2014.00011. eCollection 2014. Front Syst Neurosci. 2014. PMID: 24567704 Free PMC article. Review.
References
-
- Wise SP, Moody SL, Blomstrom KJ, Mitz AR. Changes in motor cortical activity during visuomotor adaptation. Exp Brain Res. 1998;121:285–299. - PubMed
-
- Paz R, Boraud T, Natan C, Bergman H, Vaadia E. Preparatory activity in motor cortex reflects learning of local visuomotor skills. Nat Neurosci. 2003;6:882–890. - PubMed
-
- Li CS, Padoa-Schioppa C, Bizzi E. Neuronal correlates of motor performance and motor learning in the primary motor cortex of monkeys adapting to an external force field. Neuron. 2001;30:593–607. - PubMed
Publication types
MeSH terms
Grants and funding
LinkOut - more resources
Full Text Sources
Other Literature Sources
