

Bio-distribution and toxicity assessment of intravenously injected anti-HER2 antibody conjugated CdSe/ZnS quantum dots in Wistar rats
- PMID: 21499435
- PMCID: PMC3075911
- DOI: 10.2147/IJN.S15124
Bio-distribution and toxicity assessment of intravenously injected anti-HER2 antibody conjugated CdSe/ZnS quantum dots in Wistar rats
Abstract
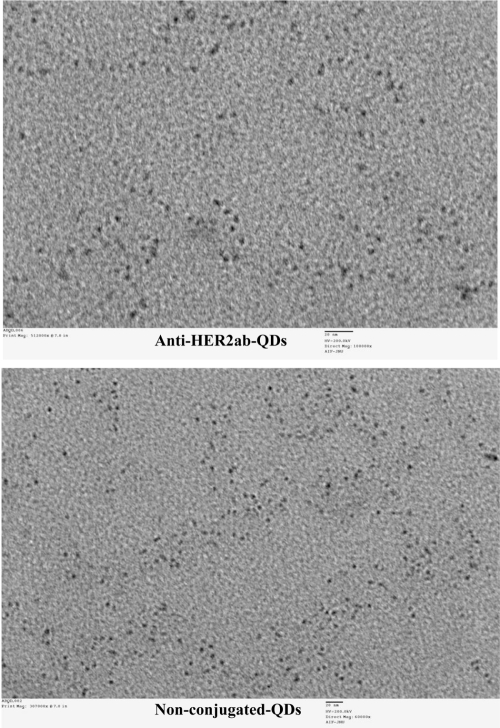
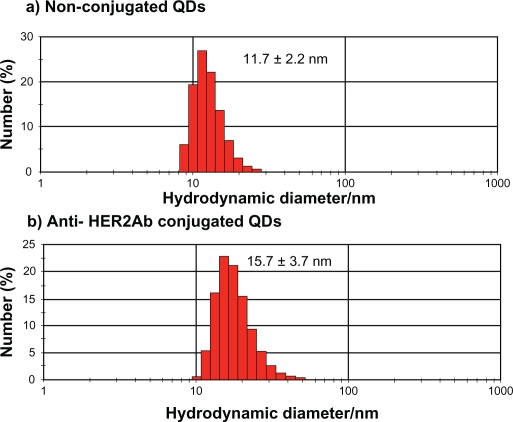
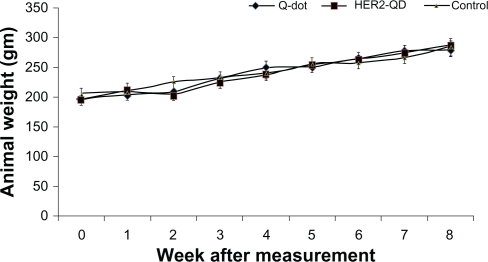
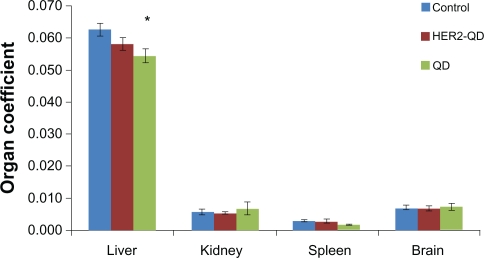
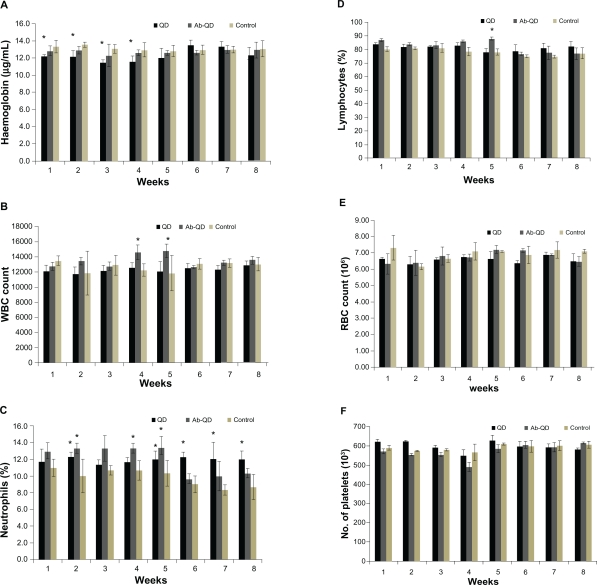
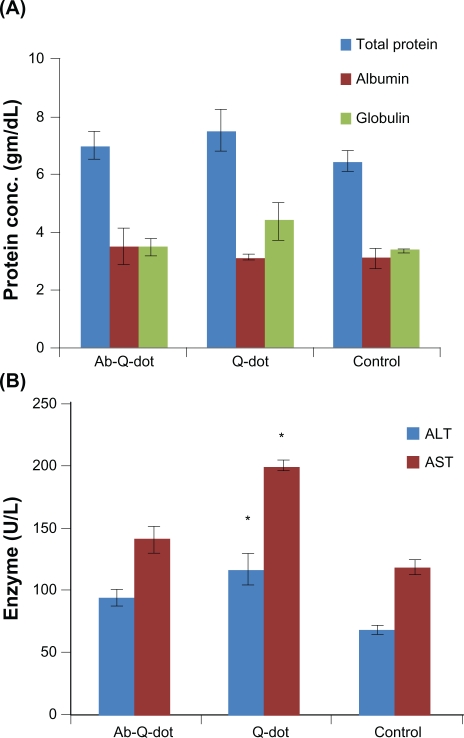
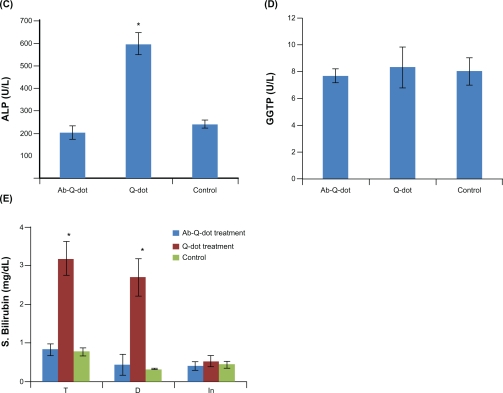
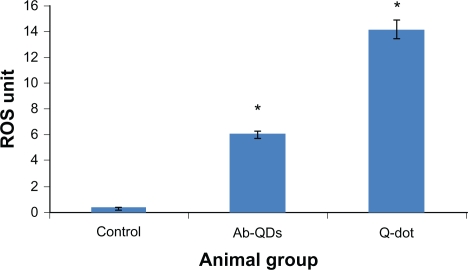
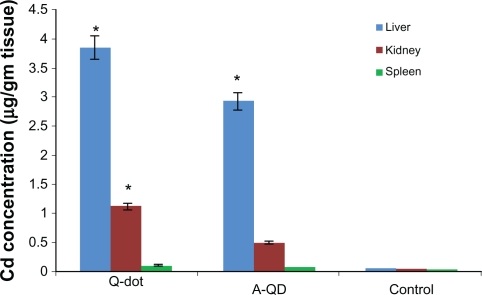
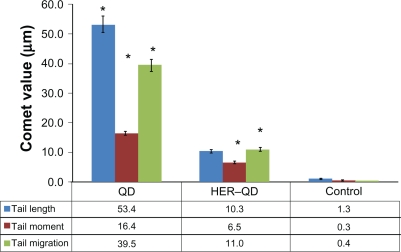
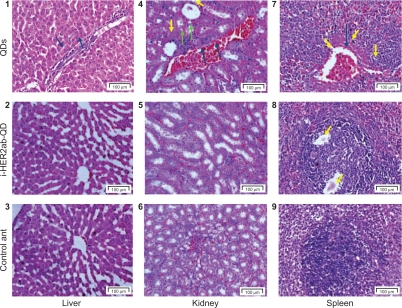
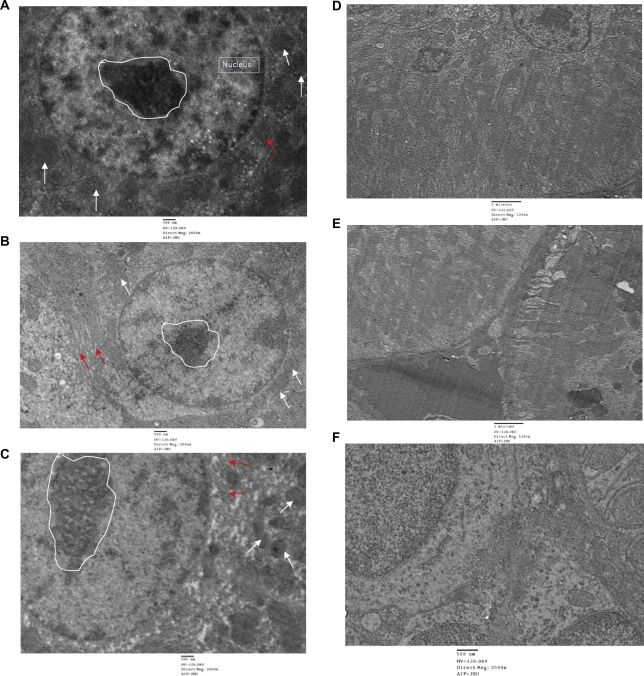
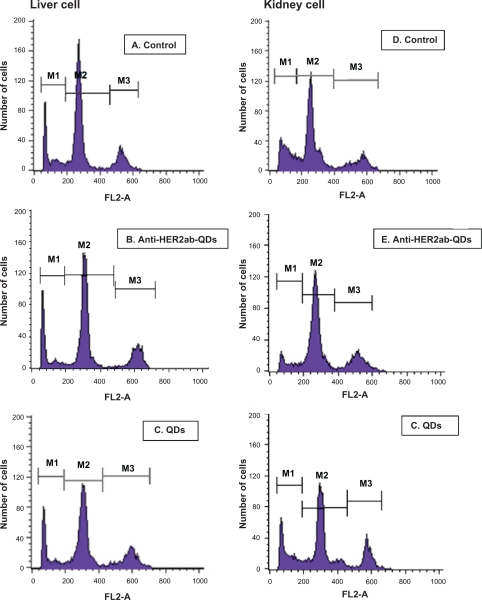
Anti-HER2 antibody conjugated with quantum dots (anti-HER2ab-QDs) is a very recent fluorescent nanoprobe for HER2+ve breast cancer imaging. In this study we investigated in-vivo toxicity of anti-HER2ab conjugated CdSe/ZnS QDs in Wistar rats. For toxicity evaluation of injected QDs sample, body weight, organ coefficient, complete blood count (CBC), biochemistry panel assay (AST, ALT, ALP, and GGTP), comet assay, reactive oxygen species, histology, and apoptosis were determined. Wistar rat (8-10 weeks old) were randomly divided into 4 treatment groups (n = 6). CBC and biochemistry panel assay showed nonsignificant changes in the anti-HER2ab-QDs treated group but these changes were significant (P < 0.05) in QDs treated group. No tissue damage, inflammation, lesions, and QDs deposition were found in histology and TEM images of the anti-HER2ab-QDs treated group. Apoptosis in liver and kidney was not found in the anti-HER2ab-QDs treated group. Animals treated with nonconjugated QDs showed comet formation and apoptosis. Cadmium deposition was confirmed in the QDs treated group compared with the anti-HER2ab-QDs treated group. The QDs concentration (500 nM) used for this study is suitable for in-vivo imaging. The combine data of this study support the biocompatibility of anti-HER2ab-QDs for breast cancer imaging, suggesting that the antibody coating assists in controlling any possible adverse effect of quantum dots.
Keywords: HER2; anti-HER2 antibody; cancer bioimaging; comet assay; quantum dots.
Figures
Similar articles
-
Cancer Cell Targeting Using Folic Acid/Anti-HER2 Antibody Conjugated Fluorescent CdSe/CdS/ZnS-MPA and CdTe-MSA Quantum Dots.J Nanosci Nanotechnol. 2015 Dec;15(12):9382-95. doi: 10.1166/jnn.2015.10767. J Nanosci Nanotechnol. 2015. PMID: 26682358
-
Synthesis and Characterization of Anti-HER2 Antibody Conjugated CdSe/CdZnS Quantum Dots for Fluorescence Imaging of Breast Cancer Cells.Sensors (Basel). 2009;9(11):9332-64. doi: 10.3390/s91109332. Epub 2009 Nov 19. Sensors (Basel). 2009. PMID: 22291567 Free PMC article.
-
Cancer Cell Targeting Using Folic Acid/Anti-HER2 Antibody Conjugated Fluorescent CdSe/CdS/ZnS-Mercaptopropionic Acid and CdTe-Mercaptosuccinic Acid Quantum Dots.J Nanosci Nanotechnol. 2016 Jan;16(1):130-43. doi: 10.1166/jnn.2016.10825. J Nanosci Nanotechnol. 2016. PMID: 27398438
-
Anti-α-Fetoprotein antibody-quantum dots.2009 Feb 6 [updated 2009 Feb 24]. In: Molecular Imaging and Contrast Agent Database (MICAD) [Internet]. Bethesda (MD): National Center for Biotechnology Information (US); 2004–2013. 2009 Feb 6 [updated 2009 Feb 24]. In: Molecular Imaging and Contrast Agent Database (MICAD) [Internet]. Bethesda (MD): National Center for Biotechnology Information (US); 2004–2013. PMID: 20641270 Free Books & Documents. Review.
-
Quantum Dots: Synthesis, Antibody Conjugation, and HER2-Receptor Targeting for Breast Cancer Therapy.J Funct Biomater. 2021 Dec 16;12(4):75. doi: 10.3390/jfb12040075. J Funct Biomater. 2021. PMID: 34940554 Free PMC article. Review.
Cited by
-
Near-infrared quantum dots for HER2 localization and imaging of cancer cells.Int J Nanomedicine. 2014 Mar 11;9:1323-37. doi: 10.2147/IJN.S51535. eCollection 2014. Int J Nanomedicine. 2014. PMID: 24648731 Free PMC article.
-
Non-invasive radiofrequency ablation of malignancies mediated by quantum dots, gold nanoparticles and carbon nanotubes.Ther Deliv. 2011 Oct;2(10):1325-30. doi: 10.4155/tde.11.102. Ther Deliv. 2011. PMID: 22826886 Free PMC article. Review.
-
Quantum dots in imaging, drug delivery and sensor applications.Int J Nanomedicine. 2017 Jul 28;12:5421-5431. doi: 10.2147/IJN.S138624. eCollection 2017. Int J Nanomedicine. 2017. PMID: 28814860 Free PMC article. Review.
-
Cane Molasses Graphene Quantum Dots Passivated by PEG Functionalization for Detection of Metal Ions.ACS Omega. 2020 Mar 3;5(12):6763-6772. doi: 10.1021/acsomega.0c00098. eCollection 2020 Mar 31. ACS Omega. 2020. PMID: 32258911 Free PMC article.
-
Antibody-based imaging of HER-2: moving into the clinic.Curr Mol Med. 2013 Dec;13(10):1523-37. doi: 10.2174/1566524013666131111120951. Curr Mol Med. 2013. PMID: 24206138 Free PMC article. Review.
References
-
- Alivisatos AP. The use of nanocrystals in biological detection. Nat Biotechnol. 2004;22:47–52. - PubMed
-
- Ferrari M. Cancer nanotechnology: opportunities and challenges. Nat Rev Cancer. 2005;5:161–171. - PubMed
-
- Niemeyer CM. Nanoparticles, proteins, and nucleic acids: biotechnology meets materials science. Angew Chem Int Ed. 2001;40:4128–4158. - PubMed
-
- Kirchner C, Liedl T, Kudera S, et al. Cytotoxicity of colloidal CdSe and CdSe/ZnS nanoparticles. Nano Lett. 2005;5:331–338. - PubMed
Publication types
MeSH terms
Substances
LinkOut - more resources
Full Text Sources
Research Materials
Miscellaneous
