

Portable, Fiber-Based, Diffuse Reflection Spectroscopy (DRS) Systems for Estimating Tissue Optical Properties
- PMID: 21499501
- PMCID: PMC3074566
- DOI: 10.1366/10-06052
Portable, Fiber-Based, Diffuse Reflection Spectroscopy (DRS) Systems for Estimating Tissue Optical Properties
Abstract
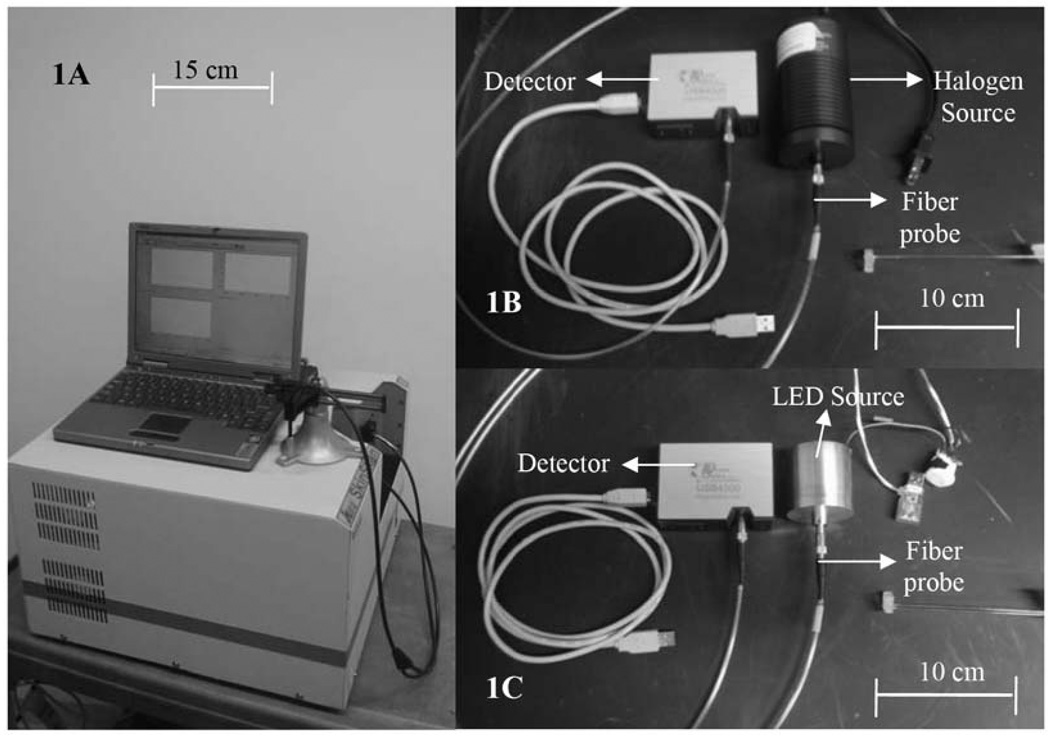
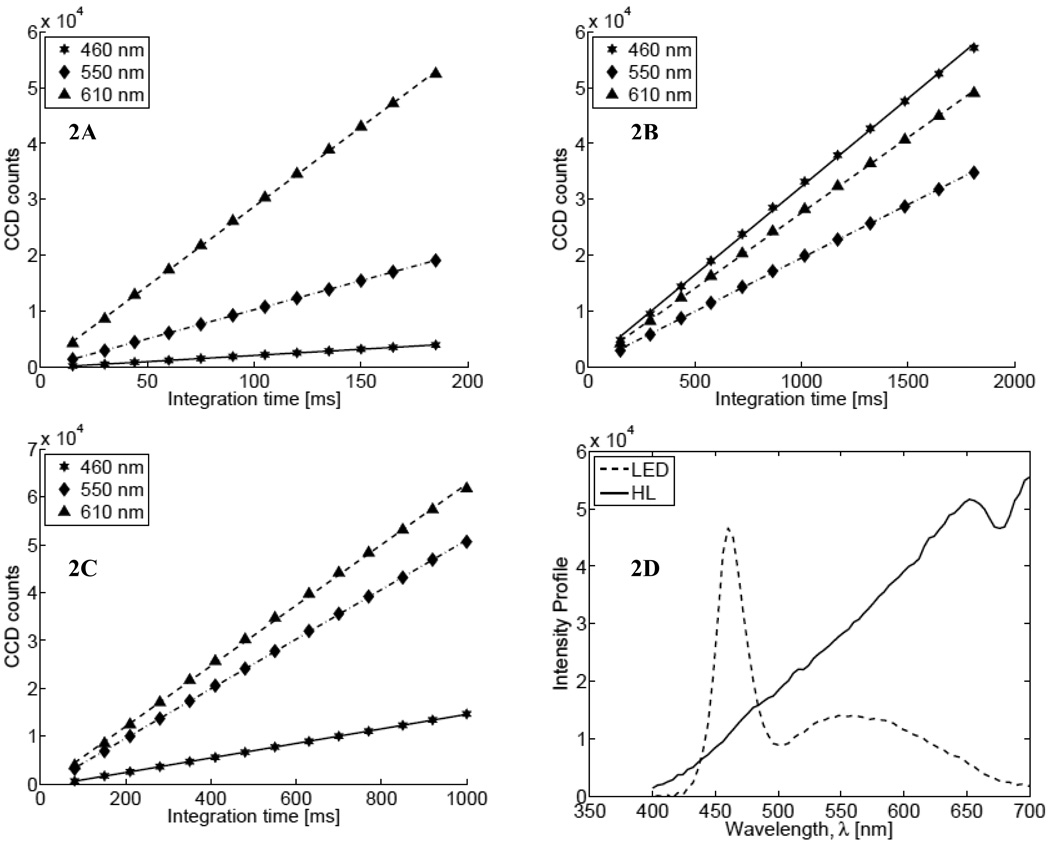
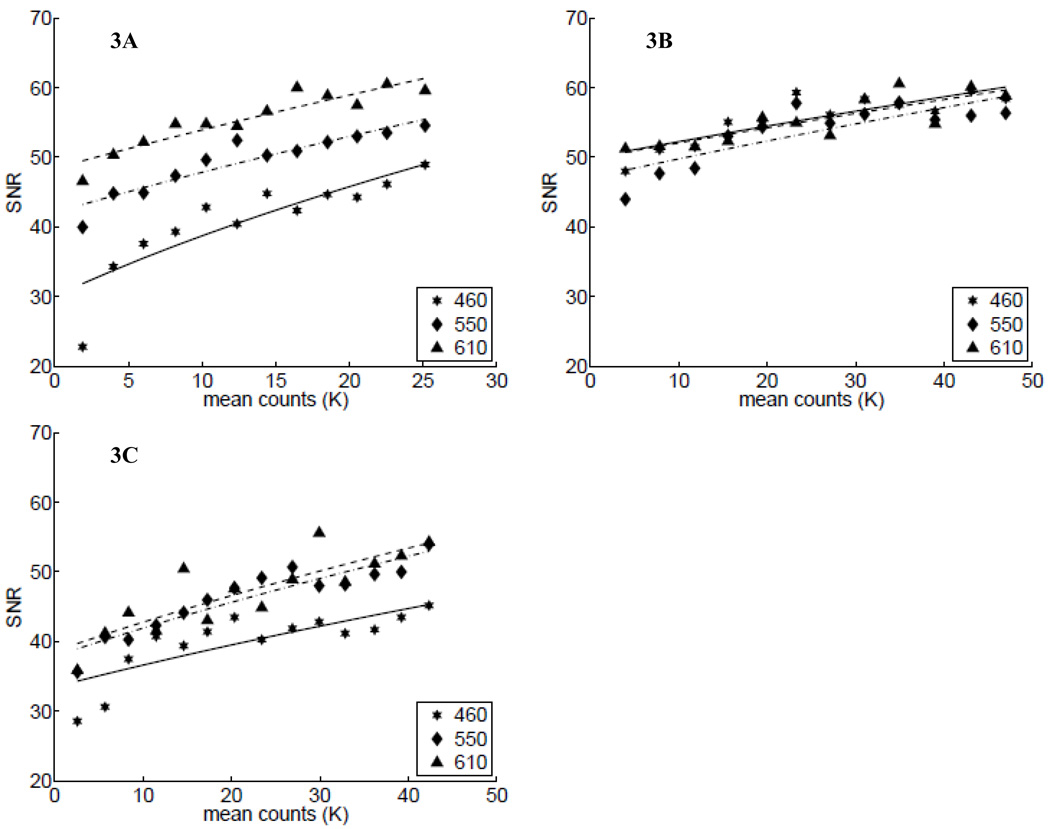
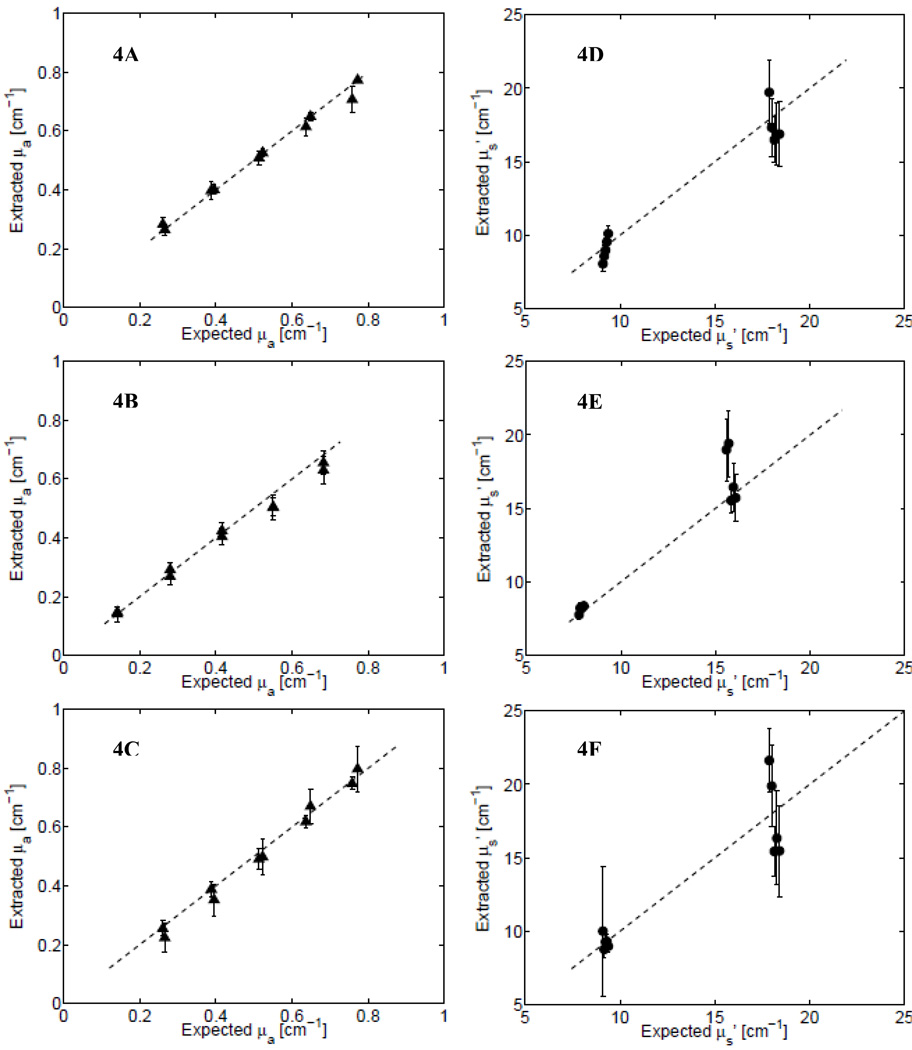
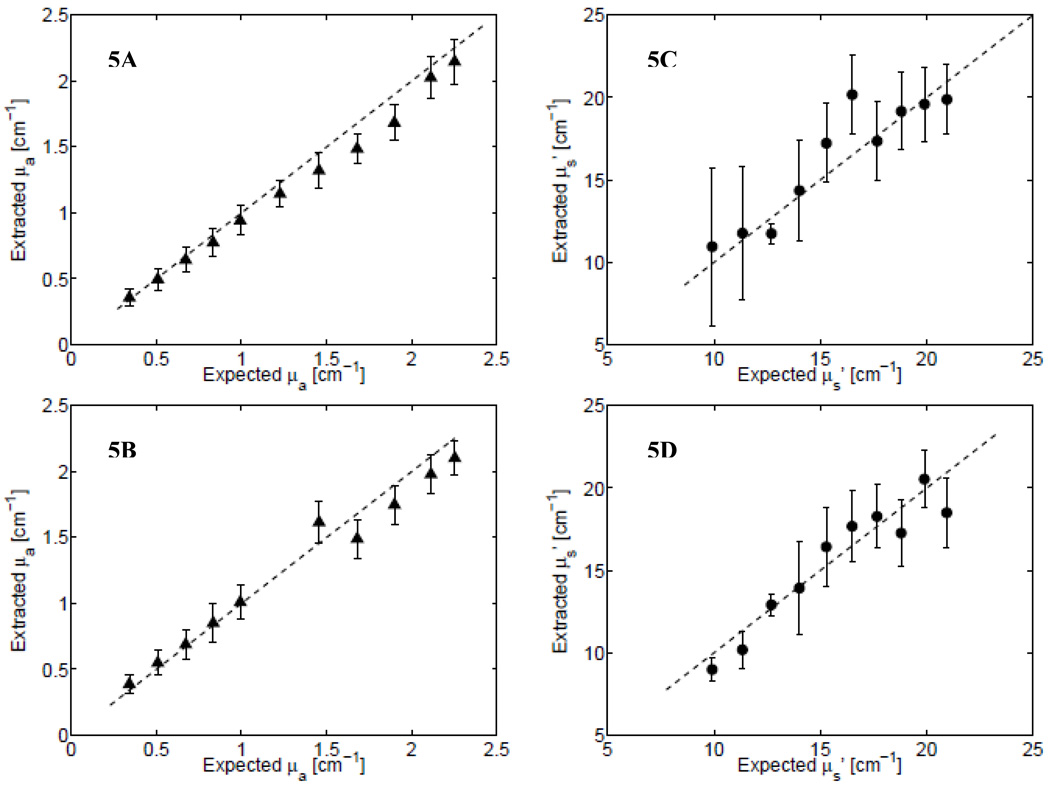
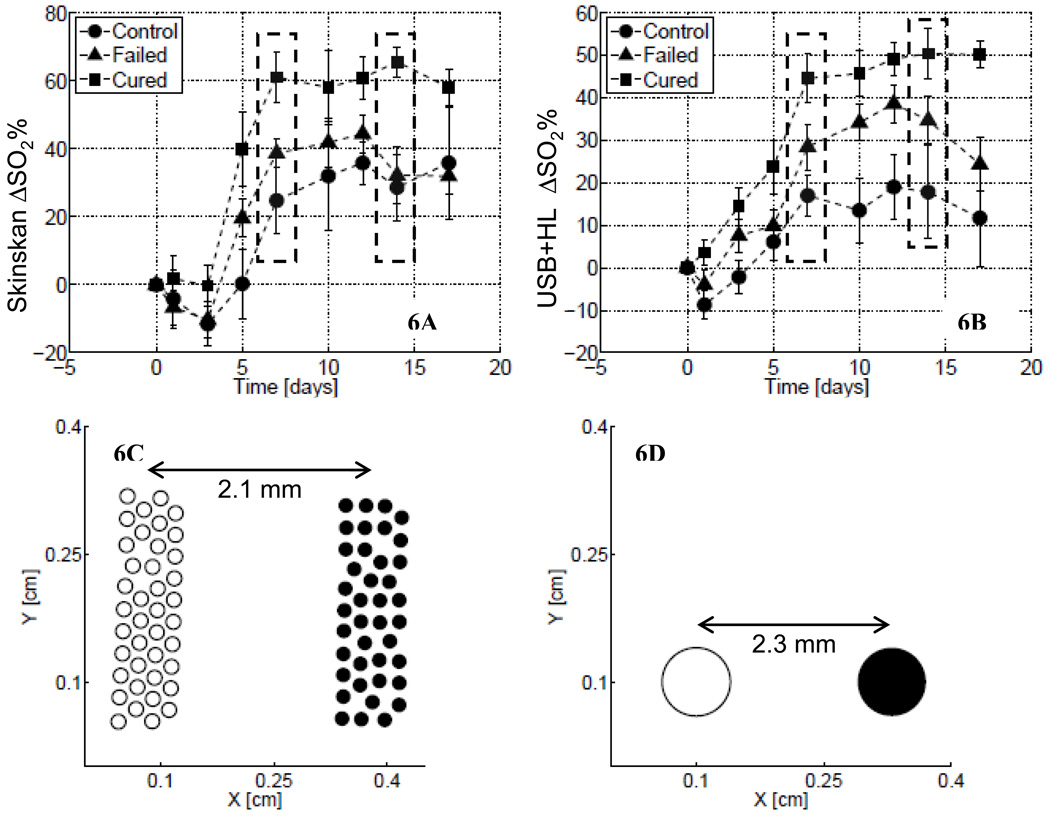
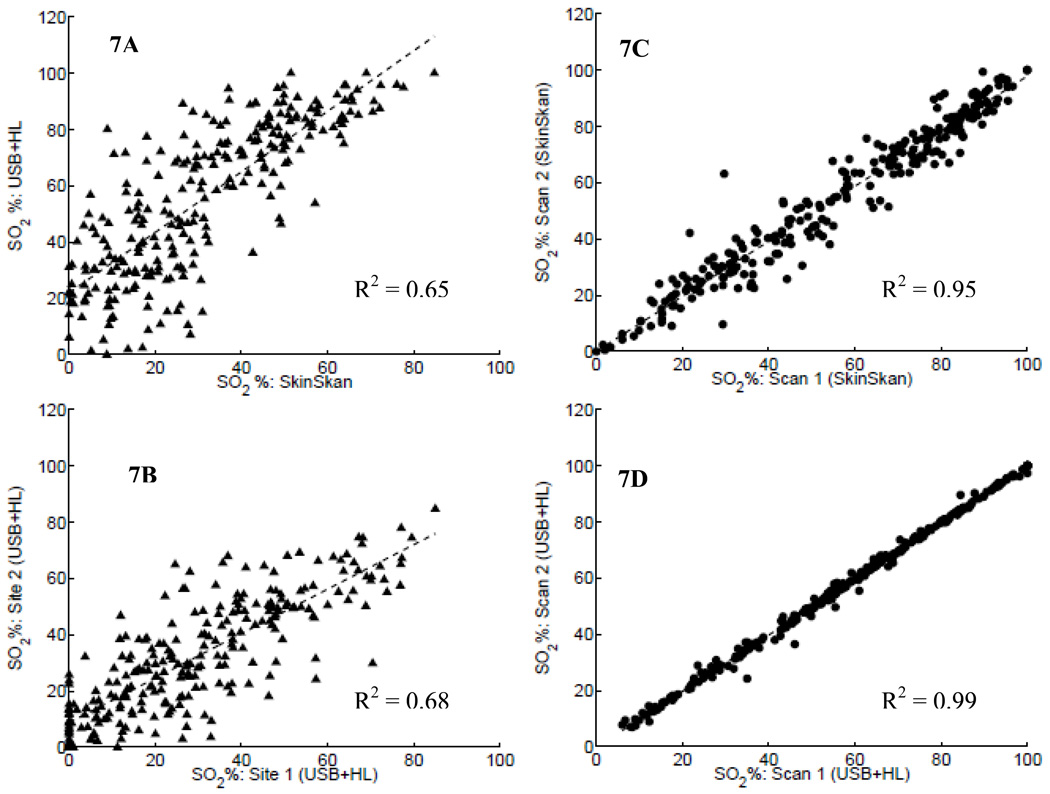
Steady-state diffuse reflection spectroscopy is a well-studied optical technique that can provide a noninvasive and quantitative method for characterizing the absorption and scattering properties of biological tissues. Here, we compare three fiber-based diffuse reflection spectroscopy systems that were assembled to create a light-weight, portable, and robust optical spectrometer that could be easily translated for repeated and reliable use in mobile settings. The three systems were built using a broadband light source and a compact, commercially available spectrograph. We tested two different light sources and two spectrographs (manufactured by two different vendors). The assembled systems were characterized by their signal-to-noise ratios, the source-intensity drifts, and detector linearity. We quantified the performance of these instruments in extracting optical properties from diffuse reflectance spectra in tissue-mimicking liquid phantoms with well-controlled optical absorption and scattering coefficients. We show that all assembled systems were able to extract the optical absorption and scattering properties with errors less than 10%, while providing greater than ten-fold decrease in footprint and cost (relative to a previously well-characterized and widely used commercial system). Finally, we demonstrate the use of these small systems to measure optical biomarkers in vivo in a small-animal model cancer therapy study. We show that optical measurements from the simple portable system provide estimates of tumor oxygen saturation similar to those detected using the commercial system in murine tumor models of head and neck cancer.
Figures
Similar articles
-
Sampling depth of a diffuse reflectance spectroscopy probe for in-vivo physiological quantification of murine subcutaneous tumor allografts.J Biomed Opt. 2018 Aug;23(8):1-14. doi: 10.1117/1.JBO.23.8.085006. J Biomed Opt. 2018. PMID: 30152204 Free PMC article.
-
[Study on the Determination System of Tissue Optical Properties Based on Diffuse Reflectance Spectrum].Guang Pu Xue Yu Guang Pu Fen Xi. 2016 May;36(5):1532-6. Guang Pu Xue Yu Guang Pu Fen Xi. 2016. PMID: 30001058 Chinese.
-
Light distribution modulated diffuse reflectance spectroscopy.Biomed Opt Express. 2016 May 6;7(6):2118-29. doi: 10.1364/BOE.7.002118. eCollection 2016 Jun 1. Biomed Opt Express. 2016. PMID: 27375931 Free PMC article.
-
Quantitative In Vivo Imaging of Tissue Absorption, Scattering, and Hemoglobin Concentration in Rat Cortex Using Spatially Modulated Structured Light.In: Frostig RD, editor. In Vivo Optical Imaging of Brain Function. 2nd edition. Boca Raton (FL): CRC Press/Taylor & Francis; 2009. Chapter 12. In: Frostig RD, editor. In Vivo Optical Imaging of Brain Function. 2nd edition. Boca Raton (FL): CRC Press/Taylor & Francis; 2009. Chapter 12. PMID: 26844326 Free Books & Documents. Review.
-
Influence of the phase function in generalized diffuse reflectance models: review of current formalisms and novel observations.J Biomed Opt. 2014;19(7):75005. doi: 10.1117/1.JBO.19.7.075005. J Biomed Opt. 2014. PMID: 25027000 Free PMC article. Review.
Cited by
-
Method for assessing the reliability of molecular diagnostics based on multiplexed SERS-coded nanoparticles.PLoS One. 2013 Apr 19;8(4):e62084. doi: 10.1371/journal.pone.0062084. Print 2013. PLoS One. 2013. PMID: 23620806 Free PMC article.
-
Sampling depth of a diffuse reflectance spectroscopy probe for in-vivo physiological quantification of murine subcutaneous tumor allografts.J Biomed Opt. 2018 Aug;23(8):1-14. doi: 10.1117/1.JBO.23.8.085006. J Biomed Opt. 2018. PMID: 30152204 Free PMC article.
-
In vivo diffuse reflectance spectroscopic analysis of fatty liver with inflammation in mice.Surg Open Sci. 2021 Jul 24;6:21-28. doi: 10.1016/j.sopen.2021.07.002. eCollection 2021 Oct. Surg Open Sci. 2021. PMID: 34458710 Free PMC article.
-
Needle-compatible miniaturized optoelectronic sensor for pancreatic cancer detection.Sci Adv. 2020 Nov 20;6(47):eabc1746. doi: 10.1126/sciadv.abc1746. Print 2020 Nov. Sci Adv. 2020. PMID: 33219025 Free PMC article.
-
Superficial dosimetry imaging of Čerenkov emission in electron beam radiotherapy of phantoms.Phys Med Biol. 2013 Aug 21;58(16):5477-93. doi: 10.1088/0031-9155/58/16/5477. Epub 2013 Jul 24. Phys Med Biol. 2013. PMID: 23880473 Free PMC article.
References
-
- Welch AJ, Gemert MJCV. Optical-thermal response of laser-irradiated tissue. New York: Plenum Press; 1995.
-
- Arridge SR, Hebden JC. Phys. Med. Biol. 1997;42:841. - PubMed
-
- Farrell TJ, Patterson MS, Wilson BC. Med. Phys. 1992;19:879. - PubMed
-
- Hebden JC, Arridge SR, Delpy DT. Phys. Med. Biol. 1997;42:825. - PubMed
Grants and funding
LinkOut - more resources
Full Text Sources
Other Literature Sources
