. 2011 Mar;14(2):F1-10.
doi: 10.1111/j.1467-7687.2010.01035.x.

Peers increase adolescent risk taking by enhancing activity in the brain's reward circuitry

Affiliations

Peers increase adolescent risk taking by enhancing activity in the brain's reward circuitry

Jason Chein et al. Dev Sci. 2011 Mar.

Abstract

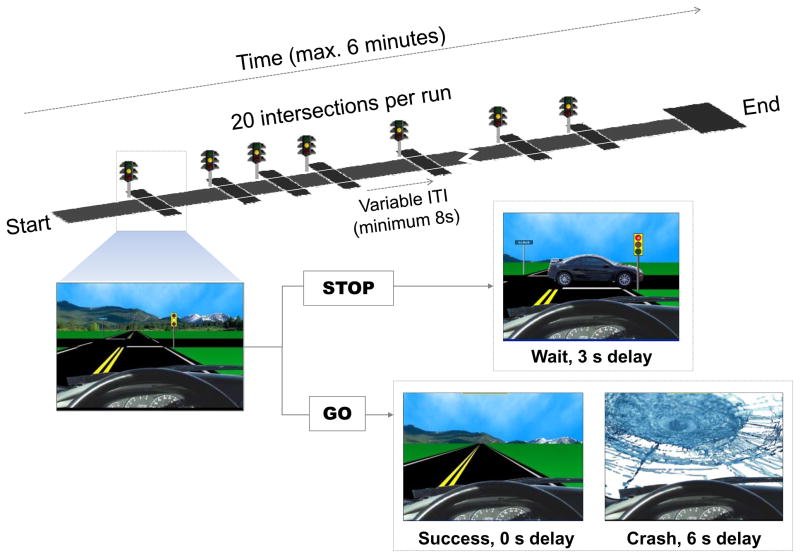
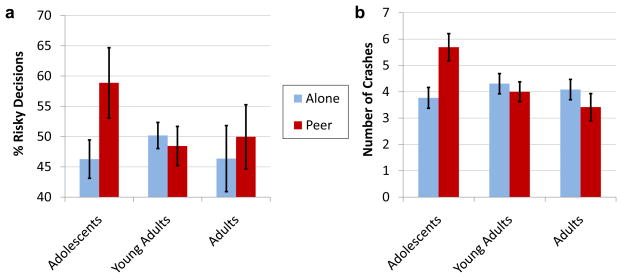
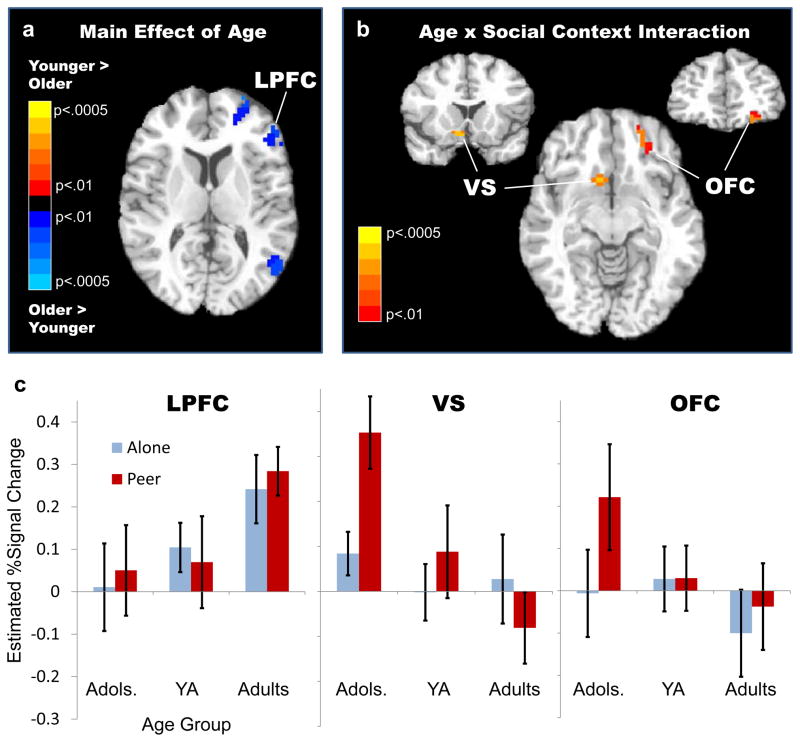
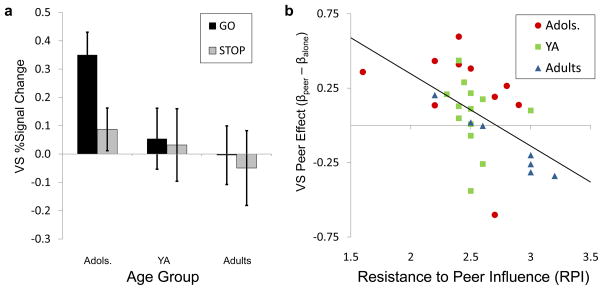
The presence of peers increases risk taking among adolescents but not adults. We posited that the presence of peers may promote adolescent risk taking by sensitizing brain regions associated with the anticipation of potential rewards. Using fMRI, we measured brain activity in adolescents, young adults, and adults as they made decisions in a simulated driving task. Participants completed one task block while alone, and one block while their performance was observed by peers in an adjacent room. During peer observation blocks, adolescents selectively demonstrated greater activation in reward-related brain regions, including the ventral striatum and orbitofrontal cortex, and activity in these regions predicted subsequent risk taking. Brain areas associated with cognitive control were less strongly recruited by adolescents than adults, but activity in the cognitive control system did not vary with social context. Results suggest that the presence of peers increases adolescent risk taking by heightening sensitivity to the potential reward value of risky decisions.


Figures

Figure 1
Figure 1
The Stoplight driving game. In each run of the Stoplight driving game, participants attempted to reach the end of a straight track as quickly as possible. The 20 intersections of the track were treated as separate trials, and were spaced by a variable distance (ITI). At each intersection, participants rendered a decision to either stop the vehicle (STOP) or to take a risk and run the traffic light (GO). Stops resulted in a short delay. Successful risk taking resulted in no delay. Unsuccessful risk taking resulted in a crash, and a relatively long delay. Subjects completed four runs of the task (two in each social condition).
Figure 2
Figure 2
Stoplight task performance. Mean (a) percentage of risky decisions and (b) number of crashes for adolescent, young adult, and adult participants when playing the Stoplight task alone and with a peer audience. Error bars indicate standard error of the mean.
Figure 3
Figure 3
Regions showing a main effect of age and an age by social condition interaction. (a) Regions showing a main effect of age, including the left lateral prefrontal cortex (LPFC, MNI peak coordinates: x = –46, y = 11, z = 26, BA 46), (b) Regions exhibiting an age × social condition interaction, including the right ventral striatum (VS, MNI peak coordinates: x = 9, y = 12, z = −8) and left orbitofrontal cortex (OFC, MNI peak coordinates: x = −22, y = 47, z = −10), and (c) Mean estimated BOLD signal change (beta coefficients) from the four peak voxels of the LPFC (left), VS (middle), and OFC (right) in adolescents (adols.), young adults (YA), and adults under ALONE and PEER conditions. Error bars indicate standard error of the mean. Brain images are shown by radiological convention (left on right), and thresholded at p < .01 for presentation purposes.
Figure 4
Figure 4
Activity in the right ventral striatum (VS). Estimated activity was extracted from an average of the four peak voxels in the VS ROI. (a) Estimated VS activity for all GO and STOP trials in adolescents (adols.), young adults (YA), and adults. Significantly different VS activity for GO relative to STOP trials was found for only the adolescents. Error bars indicate standard error of the mean. (b) Scatterplot of activity in the VS indicating an inverse linear correlation between self-reported resistance to peer influence (RPI) and the neural peer effect (βpeer − βalone).

Similar articles

Cited by

References

    1. Adolphs R. Cognitive neuroscience of human social behaviour. Nature Reviews Neuroscience. 2003;4 (3):165–178. - PubMed
    1. Asato MR, Terwilliger R, Woo J, Luna B. White matter development in adolescence: a DTI study. Cerebral Cortex. 2010;20 (9):2122–2131. - PMC - PubMed
    1. Blakemore SJ. The social brain in adolescence. Nature Reviews Neuroscience. 2008;9 (4):267–277. - PubMed
    1. Boynton GM, Engel SA, Glover GH, Heeger DJ. Linear systems analysis of functional magnetic resonance imaging in human V1. Journal of Neuroscience. 1996;16 (13):4207–4221. - PMC - PubMed
    1. Breiter HC, Rosen BR. Functional magnetic resonance imaging of brain reward circuitry in the human. Annals of the New York Academy of Sciences. 1999;877:523–547. - PubMed

Publication types

LinkOut - more resources