. 2011 Oct;89(10):997-1013.
doi: 10.1007/s00109-011-0756-0. Epub 2011 Apr 16.

Fibrocyte-like cells recruited to the spleen support innate and adaptive immune responses to acute injury or infection

Affiliations

Fibrocyte-like cells recruited to the spleen support innate and adaptive immune responses to acute injury or infection

Tatiana Kisseleva et al. J Mol Med (Berl). 2011 Oct.

Abstract

Bone marrow (BM)-derived fibrocytes are a population of CD45(+) and collagen Type I-expressing cells that migrate to the spleen and to target injured organs, such as skin, lungs, kidneys, and liver. While CD45(+)Col(+) fibrocytes contribute to collagen deposition at the site of injury, the role of CD45(+)Col(+) cells in spleen has not been elucidated. Here, we demonstrate that hepatotoxic injury (CCl(4)), TGF-β1, lipopolysaccharide, or infection with Listeria monocytogenes induce rapid recruitment of CD45(+)Col(+) fibrocyte-like cells to the spleen. These cells have a gene expression pattern that includes antimicrobial factors (myleoperoxidase, cathelicidin, and defensins) and MHC II at higher levels than found on quiescent or activated macrophages. The immune functions of these splenic CD45(+)Col(+) fibrocyte-like cells include entrapment of bacteria into extracellular DNA-based structures containing cathelicidin and presentation of antigens to naïve CD8(+) T cells to induce their proliferation. Stimulation of these splenic fibrocyte-like cells with granulocyte macrophage-colony stimulating factor or macrophage-colony stimulating factor induces downregulation of collagen expression and terminal differentiation into the dendritic cells or macrophage. Thus, splenic CD45(+)Col(+) cells are a population of rapidly mobilized BM-derived fibrocyte-like cells that respond to inflammation or infection to participate in innate and adaptive immune responses.


Figures
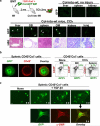
Fig. 1
Fig. 1
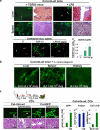
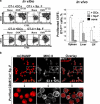
CD45+Col+ cells migrate to spleen in response to CCl4. a Outline of the experiment: lethally irradiated wild-type mice are transplanted with Col-GFP+ BM, and 2 months later subjected to liver injury by CCl4. CD45+Col+ were not detected in the liver or spleen of Col-into-wt mice without injury or stress (n=15), upper panel. The organs populated by CD45+Col+ cells in Col-into-wt mice in response to CCl4-induced liver injury are liver, gall bladder (GB), spleen, mesentery lymph nodes (LN), and omentum majus (OM), as analyzed by fluorescent microscopy and H&E staining, lower panel (n=25). Scale bars represent 50 μm. b Col+ cells co-express CD45, as detected by immunofluorescence or flow cytometry analysis. In response to CCl4, the number of CD45+Col+ cells reached 1.3% in the BM and 4.1% in spleen. Without injury, CD45+Col+ cells constituted 0.1% in the BM and were undetectable (0.0%, not shown) in spleen. Dot plot is representative of ten independent experiments. c Splenic CD45+Col+ cells, cultured on plastic in RPMI+10% FCS+TGF-β1 (5 ng/ml), differentiate into α-SMA+ myofibroblasts cells. Representative images of three independent experiments are shown
Fig. 2
Fig. 2
TGF-β1, LPS, and Listeria monocytogenes induce migration of CD45+Col+ cells to spleen and liver in vivo. a Col-into-wt mice are i.v. infected with TGF-β1-expressing adenovirus (1×10⁸ pfu) or control adenovirus, or injected with LPS (6 μg/g). After 72 h, GFP+ cells (white arrows) are detected by immunofluorescence (GC-germinal center, RP-red pulp) or flow cytometry (mean fluorescent intensity±SEM (n=5 mice/group, *p<0.001). Collagen deposition was estimated by TriChrome staining (blue arrows), which shows lack of collagen deposition in spleen. b Mobilization of CD45+Col+ cells in response to L. monocytogenes infection. Col-into-wt mice are infected with L. monocytogenes (4×10⁶ cfu) for 24 h. GFP+ cells are detected in livers and spleens but not kidneys, as visualized by fluorescent microscopy using a ×10 objective, left panel. The bacterial load of organ homogenates is calculated for liver (8.6±2×10⁷ cfu/g), spleen (3.7±2×10⁸ cfu/g), and kidney (8±4×10⁵ cfu/g). The data represent the average of three mice. c The effect of splenic CD45+Col+ cells on liver fibrosis is studied in splenectomized mice. Outline of the experiment: spleen is surgically removed (−Sp) in experimental group of mice. Left panel, fluorescent micrographs of liver obtained from splenectomized or sham-operated CCl4-treated Col-into-wt mice and Col-GFP mice. Phase contrast micrographs are TriChrome staining of liver tissues, obtained for each group of mice. Right panel, liver tissues from splenectomized or sham-operated Col-into-wt mice are analyzed for GFP+ or TriChrome-positive areas. mRNA levels of collagen α1(I) expression in splenic CD45+Col+ cells was compared with hepatic stellate cells (SC), as detected by RT-PCR. The data are presented as mean±SEM, *p<0.001
Fig. 3
Fig. 3
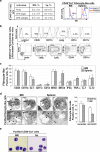
Phenotyping of splenic CD45+Col+ cells from LPS-treated mice. a Response of splenic CD45+Col+ cells to LPS. Col-GFP mice are subjected to single or multiple (n=3) LPS injections. The number of CD45+Col+ cells in the BM and spleen was analyzed 3 or 9 days later, respectively. CD45+Col+ cells migrated to spleen after single LPS (0.5±0.2%) and multiple LPS injections (4.3±0.9%, of total splenocytes). Mean±SEM are shown (n=13 assays, left panel). Right panel, histograms show MHC II expression by BM and splenic CD45+Col+ cells, stained with anti-MHC II antibody (blue) or isotype matched control antibody (red). Representative dot plots are shown. b Splenic CD45+Col+ cells from LPS-treated Col-GFP mice were analyzed by flow cytometry. Representative histograms and dot plots are shown. c Comparison of surface markers expression by BM and splenic CD45+Col+ cells. CD45+Col+ cells from BM and spleen of LPS-treated Col-GFP mice are analyzed by flow cytometry for CD11b, F4/80, Gr-1, CD11c, MHC I, MHC II, surface markers, and intracellular cytokines (IFN-γ, TNF-α, and IL-1). Bars represent the mean fluorescent intensity±SEM of three independent experiments. d Electron micrographs of the BM and splenic CD45+Col+ cells. CD45+Col+ cells are studied by EM at a magnification of ×6,000, upper panel, and ×10,000, lower panel. Vacuoles are marked with arrows, and electron-dense ER is marked with asterisks. Other features are listed as N (nucleus), MV (microvili), and MPV (micropinocytotic vesicles). EMs are representative images from ten random fields per sample. e BM and splenic CD45+Col+ exhibited similar morphology, detected by Wright–Giemsa staining, and visualized as round cells, with a basophilic and vacuolated cytoplasm with occasional basophilic granules. Representative images from nine to ten random fields using a ×60 objective
Fig. 4
Fig. 4
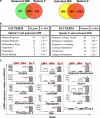
Comparison of splenic CD45+Col+ cells and macrophages. a Gene expression microarray of splenic CD45+Col+ cells. Splenic CD45+Col+ cells from LPS-treated mice and peritoneal macrophages (MΦ) from thioglycollate-stimulated mice, unstimulated (quiescent), or Kdo2-lipid A-treated (100 ng/ml, 6 h, activated) are compared by gene expression microarray. Venn diagram shows the number of shared and distinct genes. b Gene expression overlap identified for each group, presented as GO TERM with the p values indicated for each group. c Gene expression analysis of fibrocyte precursor-specific genes by RT-PCR. Relative mRNA levels are calculated for qMΦ, aMΦ, and splenic FPs after normalization to GAPDH gene using the ΔΔ CT method. Genes are listed as Chi3l3 (chitinase 3-like 3), Ngp (neutrophilic granular protein), IL-18R (interleukin 18 receptor), mCRAMP (cathelicidin antimicrobial peptide), and Vcam-1 (vascular cell adhesion molecule). Fold induction of gene expression in splenic CD45+Col+ cells is shown in comparison with the highest value detected in qMΦ or aMΦ, p>0.0001
Fig. 5
Fig. 5
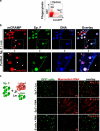
Splenic CD45+Col+ cells possess anti-microbial properties. a Splenic CD45+Col+ cells lack phagocytic activity. Splenic MΦ but not splenic CD45+Col+ fibrocyte-like cells (Sp. F) phagocytosed flouro-ruby dextran (10,000 MW), as detected by flow cytometry after 15 min of co-culturing. Dot plot is representative of three experiments. b Splenic CD45+Col+ cells release antimicrobial extracellular DNA-traps to entrap and kill L. monocytogenes (Lm). CD45+Col+ cells co-incubated with L. monocytogenes are stained with anti-mCRAMP Ab, visualized in red (Alexa fluor 568). DNA traps are visualized in blue (Dapi); fibrocytes-like cells are visualized in green (GFP). Bar represents 20 μm. c Release of extracellular traps is associated with death of splenic CD45+Col+ cells. Splenic CD45+Col+ cells are co-incubated with L. monocytogenes or PMA for 30 min and analyzed for live/dead cells using Mammalian Cells Viability Kit, right panel. Splenic CD45+Col+ cells are compared to PMA-treated GFP+ B cells (from β-actin-GFP mice). Dead cells and DNA traps are visualized in red (PI). Bar represents 20 μm d Splenic CD45+Col+ cells reduce viability of L. monocytogenes in vitro after 30 min of co-incubation, as shown in upper and middle panel. Dead bacteria are visualized in red (PI; red arrows) using Live/Dead Bacterial Viability Kit versus live bacteria (green). In addition to fluorescence microscopy, surviving bacteria were quantified by plating surviving colony-forming units on agar plates. Data are shown as mean values±SD of surviving colony-forming units per milliliter. Lower panel, B cells co-cultured with L. monocytogenes serve as control. e Characterization of the extracellular DNA structures formed by splenic CD45+Col+ cells, untreated or 30 min after incubation with L. monocytogenes, PMA. The number of DNA traps, mCRAMP+ cells, viability of trap-forming cells, and dead bacteria is evaluated. B cells, isolated from the same mice and cultured with L. monocytogenes, served as a negative control. The data are presented as percent of positive cells calculated ±SEM, p≤0.005
Fig. 5
Fig. 5
Splenic CD45+Col+ cells possess anti-microbial properties. a Splenic CD45+Col+ cells lack phagocytic activity. Splenic MΦ but not splenic CD45+Col+ fibrocyte-like cells (Sp. F) phagocytosed flouro-ruby dextran (10,000 MW), as detected by flow cytometry after 15 min of co-culturing. Dot plot is representative of three experiments. b Splenic CD45+Col+ cells release antimicrobial extracellular DNA-traps to entrap and kill L. monocytogenes (Lm). CD45+Col+ cells co-incubated with L. monocytogenes are stained with anti-mCRAMP Ab, visualized in red (Alexa fluor 568). DNA traps are visualized in blue (Dapi); fibrocytes-like cells are visualized in green (GFP). Bar represents 20 μm. c Release of extracellular traps is associated with death of splenic CD45+Col+ cells. Splenic CD45+Col+ cells are co-incubated with L. monocytogenes or PMA for 30 min and analyzed for live/dead cells using Mammalian Cells Viability Kit, right panel. Splenic CD45+Col+ cells are compared to PMA-treated GFP+ B cells (from β-actin-GFP mice). Dead cells and DNA traps are visualized in red (PI). Bar represents 20 μm d Splenic CD45+Col+ cells reduce viability of L. monocytogenes in vitro after 30 min of co-incubation, as shown in upper and middle panel. Dead bacteria are visualized in red (PI; red arrows) using Live/Dead Bacterial Viability Kit versus live bacteria (green). In addition to fluorescence microscopy, surviving bacteria were quantified by plating surviving colony-forming units on agar plates. Data are shown as mean values±SD of surviving colony-forming units per milliliter. Lower panel, B cells co-cultured with L. monocytogenes serve as control. e Characterization of the extracellular DNA structures formed by splenic CD45+Col+ cells, untreated or 30 min after incubation with L. monocytogenes, PMA. The number of DNA traps, mCRAMP+ cells, viability of trap-forming cells, and dead bacteria is evaluated. B cells, isolated from the same mice and cultured with L. monocytogenes, served as a negative control. The data are presented as percent of positive cells calculated ±SEM, p≤0.005
Fig. 6
Fig. 6
Alternative functions of splenic CD45+Col+ fibrocyte-like cells. a Splenic CD45+Col+ fibrocyte-like cells possess properties of antigen presenting (APC) cells. Splenic fibrocyte-like cells present antigens on MHC I (H2-Kb) and MHCII (I-Ab) in vitro, left panel. DCs and splenic CD45+Col+ cells (5×10⁴ cells) untreated or loaded with OVA257–264 or OVA323–339 are co-cultured for 4 days with CFSE-labeled CD8+ OT-I or CD4+ OT-II T cells (1.5×10⁵), respectively. Proliferation is measured by CFSE dilution in activated CD44+ T cells. Representative dot plots are shown. Splenic CD45+Col+ cells induce proliferation of adoptively transferred CFSE-OT-I/bm1 CD8+ T cells in Act-mOVA/bm1 mice, right panel. Proliferation of CFSE-labeled T cells in the liver, spleen, and peripheral lymph nodes (LN) was analyzed 4 days later by flow cytometry. Data represent mean±SEM. b A subset of splenic CD45+Col+ cells co-express MHC II and mCRAMP. Purified from spleens LPS-treated mice, CD45+Col+ cells are co-stained with anti-mCRAMP and anti-MHC II antibodies. Upper panel, co-localization of MHC II (shown in white) and mCRAMP (red) is detected in 43±7% of cells. Bar represents 30 μm. Lower panel, representative images are magnified five times; double positive cells are marked with arrows c Splenic CD45+Col+ cells differentiate into myeloid (CD11b+CD14+F4/80+) or dendritic (CD11b+CD11c+) cells in response to M-CSF (30% L-cell medium) or GM-CSF (20 ng/ml), respectively, detected by flow cytometry, upper panel. Lower panel, phagocytosis of FITC-labeled Escherichia coli by M-CSF-differentiated splenic CD45+Col+ cells or BM-derived macrophages. The number of phagocytosed E. coli-FITC particles increases over time. Representative images of three independent experiments are shown d Splenic fibrocytes give rise to CD11b+ (76%), CD11b+CD11c+ (2.6%), CD11bCD11c+ (3.7%), and Gr-1+ (9%) cells, when transferred into sublethally irradiated (600 Rad) CD45.1+ mice (n=10). Fibrocyte differentiation is accompanied by the loss of collagen-GFP expression. Dot blot analysis: representative images of five experiments are shown
Fig. 6
Fig. 6
Alternative functions of splenic CD45+Col+ fibrocyte-like cells. a Splenic CD45+Col+ fibrocyte-like cells possess properties of antigen presenting (APC) cells. Splenic fibrocyte-like cells present antigens on MHC I (H2-Kb) and MHCII (I-Ab) in vitro, left panel. DCs and splenic CD45+Col+ cells (5×10⁴ cells) untreated or loaded with OVA257–264 or OVA323–339 are co-cultured for 4 days with CFSE-labeled CD8+ OT-I or CD4+ OT-II T cells (1.5×10⁵), respectively. Proliferation is measured by CFSE dilution in activated CD44+ T cells. Representative dot plots are shown. Splenic CD45+Col+ cells induce proliferation of adoptively transferred CFSE-OT-I/bm1 CD8+ T cells in Act-mOVA/bm1 mice, right panel. Proliferation of CFSE-labeled T cells in the liver, spleen, and peripheral lymph nodes (LN) was analyzed 4 days later by flow cytometry. Data represent mean±SEM. b A subset of splenic CD45+Col+ cells co-express MHC II and mCRAMP. Purified from spleens LPS-treated mice, CD45+Col+ cells are co-stained with anti-mCRAMP and anti-MHC II antibodies. Upper panel, co-localization of MHC II (shown in white) and mCRAMP (red) is detected in 43±7% of cells. Bar represents 30 μm. Lower panel, representative images are magnified five times; double positive cells are marked with arrows c Splenic CD45+Col+ cells differentiate into myeloid (CD11b+CD14+F4/80+) or dendritic (CD11b+CD11c+) cells in response to M-CSF (30% L-cell medium) or GM-CSF (20 ng/ml), respectively, detected by flow cytometry, upper panel. Lower panel, phagocytosis of FITC-labeled Escherichia coli by M-CSF-differentiated splenic CD45+Col+ cells or BM-derived macrophages. The number of phagocytosed E. coli-FITC particles increases over time. Representative images of three independent experiments are shown d Splenic fibrocytes give rise to CD11b+ (76%), CD11b+CD11c+ (2.6%), CD11bCD11c+ (3.7%), and Gr-1+ (9%) cells, when transferred into sublethally irradiated (600 Rad) CD45.1+ mice (n=10). Fibrocyte differentiation is accompanied by the loss of collagen-GFP expression. Dot blot analysis: representative images of five experiments are shown

References

    1. Quan TE, Cowper S, Wu SP, Bockenstedt LK, Bucala R. Circulating fibrocytes: collagen-secreting cells of the peripheral blood. Int J Biochem Cell Biol. 2004;36:598–606. doi:10.1016/j.biocel.2003.10.005. - PubMed
    1. Phillips RJ, Burdick MD, Hong K, Lutz MA, Murray LA, Xue YY, Belperio JA, Keane MP, Strieter RM. Circulating fibrocytes traffic to the lungs in response to CXCL12 and mediate fibrosis. J Clin Invest. 2004;114:438–446. doi:10.1172/JCI20997. - PMC - PubMed
    1. Hashimoto N, Jin H, Liu T, Chensue SW, Phan SH. Bone marrow-derived progenitor cells in pulmonary fibrosis. J Clin Invest. 2004;113:243–252. - PMC - PubMed
    1. Galan A, Cowper SE, Bucala R. Nephrogenic systemic fibrosis (nephrogenic fibrosing dermopathy). Curr Opin Rheumatol. 2006;18:614–617. doi:10.1097/01.bor.0000245725.94887.8d. - PubMed
    1. Kisseleva T, Brenner DA. Fibrogenesis of parenchymal organs. Proc Am Thorac Soc. 2008;5:338–342. doi:10.1513/pats.200711-168DR. - PMC - PubMed

Publication types

MeSH terms

Substances