. 2011 Oct;37(5):1442-57.
doi: 10.1037/a0023510.

Direct perception of action-scaled affordances: the shrinking gap problem

Affiliations

Direct perception of action-scaled affordances: the shrinking gap problem

Brett R Fajen et al. J Exp Psychol Hum Percept Perform. 2011 Oct.

Abstract

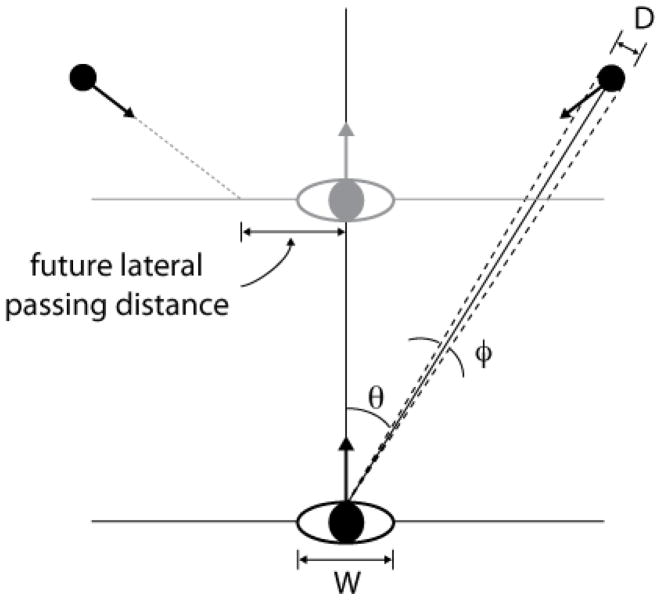
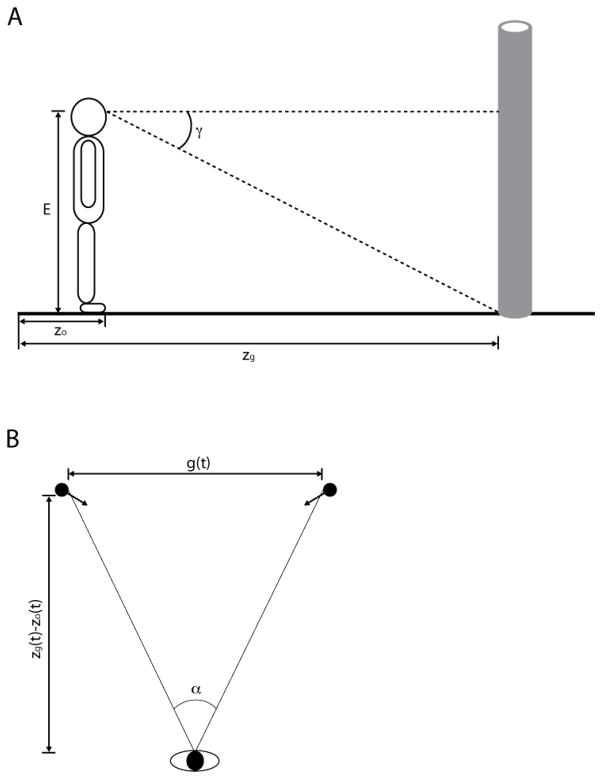
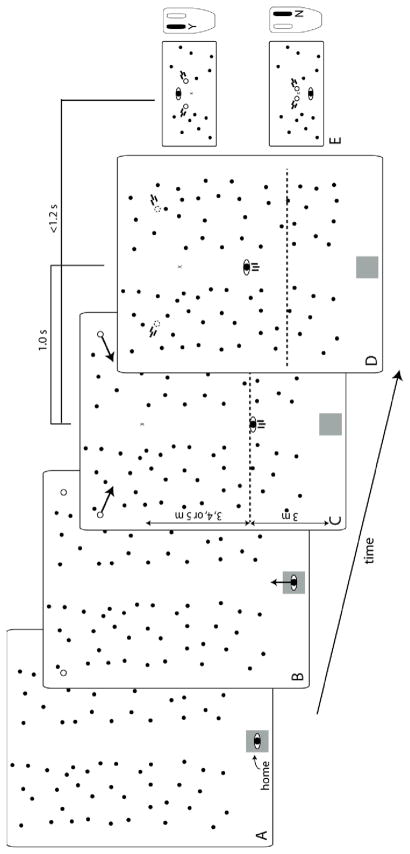
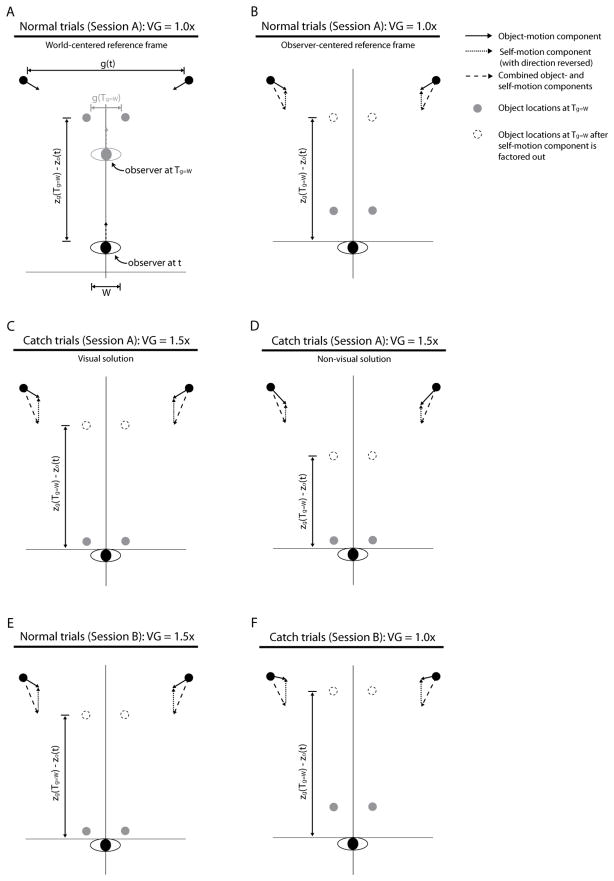
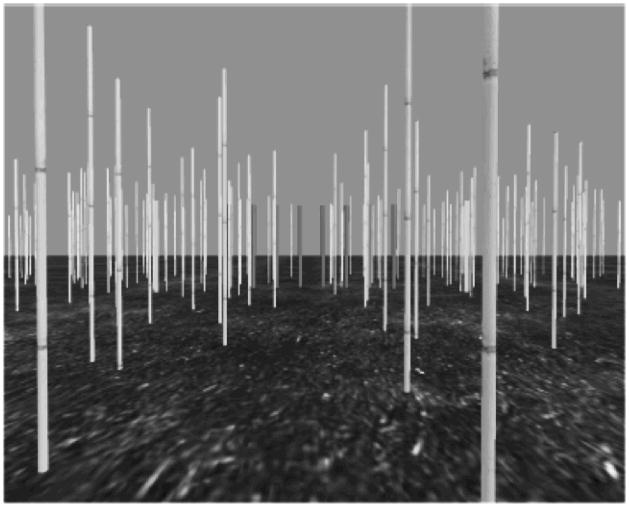
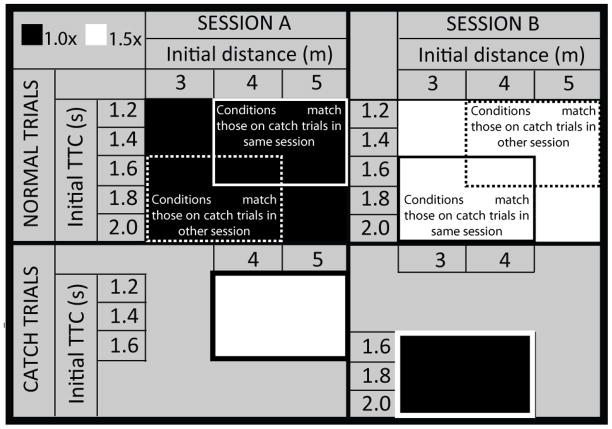
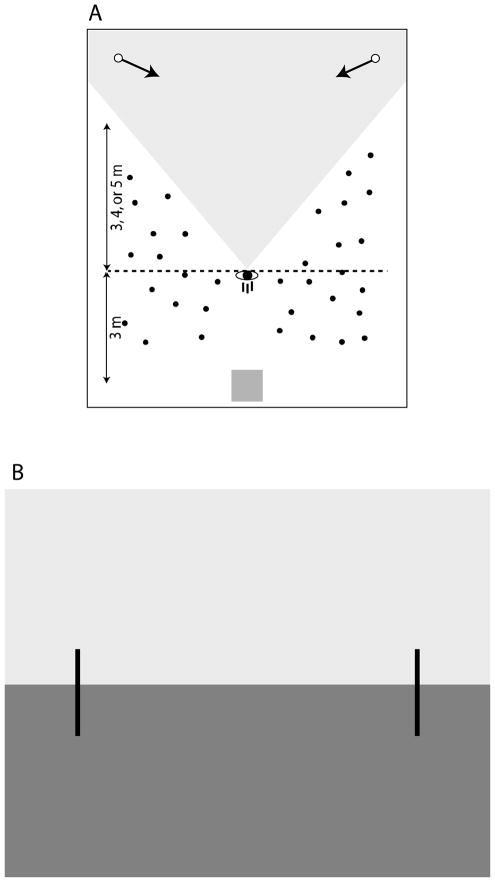
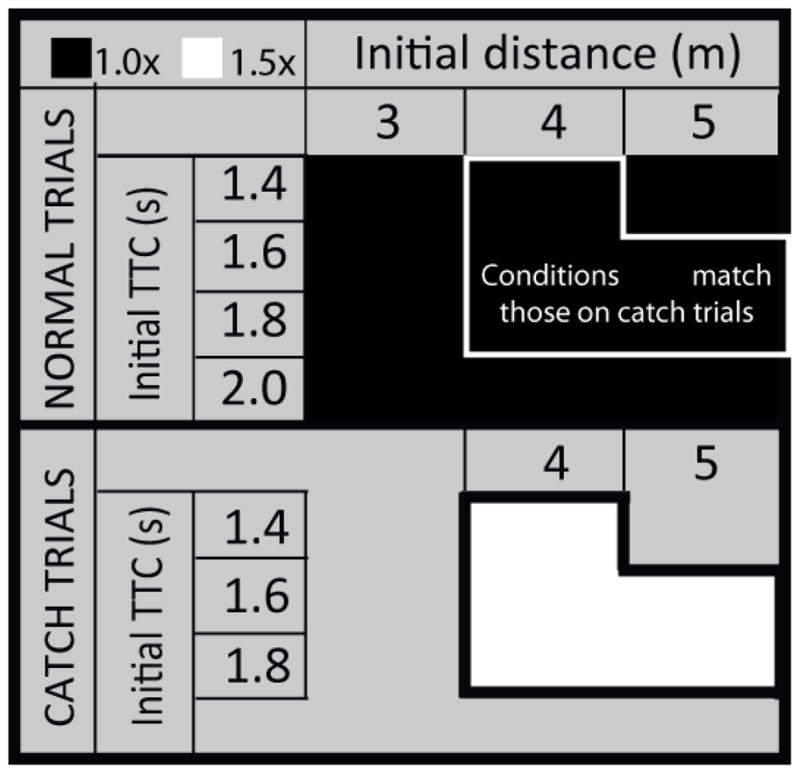
The aim of this study was to investigate the perception of possibilities for action (i.e., affordances) that depend on one's movement capabilities, and more specifically, the passability of a shrinking gap between converging obstacles. We introduce a new optical invariant that specifies in intrinsic units the minimum locomotor speed needed to safely pass through a shrinking gap. Detecting this information during self-motion requires recovering the component of the obstacles' local optical expansion attributable to obstacle motion, independent of self-motion. In principle, recovering the obstacle motion component could involve either visual or non-visual self-motion information. We investigated the visual and non-visual contributions in two experiments in which subjects walked through a virtual environment and made judgments about whether it was possible to pass through a shrinking gap. On a small percentage of trials, visual and non-visual self-motion information were independently manipulated by varying the speed with which subjects moved through the virtual environment. Comparisons of judgments on such catch trials with judgments on normal trials revealed both visual and non-visual contributions to the detection of information about minimum walking speed.


Figures

Figure 1
Figure 1
Top down view of an observer (width W) moving along a straight path, with two obstacles (diameter D) converging on a point along the observer’s future path. θ is the visual direction of the obstacle relative to the direction of locomotion and φ is the visual angle subtended by the obstacle. The distance along the frontal plane from the observer to the obstacles at the moment that the obstacles pass by the observer is the future lateral passing distance. In this example, the future lateral passing distance is greater than [½(W+D)], indicating that the observer will safely pass through the gap if current speed is maintained.
Figure 2
Figure 2
Top down view of observer and a pair of converging obstacles at time t (black circles) and time Tg=w (gray circles). Tg=W is the time at which the size of the gap between the obstacles is equal to the observer’s body width (W). g is the size of the gap, zo is the position of the observer, and zg is the position of the gap.
Figure 3
Figure 3
(A) Side view of observer and cylindrical obstacle, showing angular declination of base of obstacle (γ), and eyeheight (E). (B) Top down view of observer and a pair of converging obstacles, showing visual angle of gap (α), gap size (g), and gap distance (zg − zo).
Figure 4
Figure 4
Sequence of events in task used in Experiment 1.
Figure 5
Figure 5
Predictions for normal and catch trials in Experiment 1.
Figure 6
Figure 6
Grayscale version of screenshot of virtual environment used in Experiment 1.
Figure 7
Figure 7
Schematic of design of Experiment 1. The four main quadrants represent normal and catch trials in Sessions A and B. Within each quadrant, values along the top row correspond to initial distances and values along the side correspond to initial TTCs. Conditions in which visual gain was set to 1.0× (i.e., normal trials in Session A and catch trials in Session B) are shaded black, and conditions in which visual gain was set to 1.5× are shaded white. The subset of normal trials with initial conditions that match the initial conditions on catch trials in the same session are enclosed by the rectangles with solid lines. Likewise, the subset of normal trial with initial conditions that match the initial conditions on catch trials in the other session are enclosed by the rectangles with dotted lines.
Figure 8
Figure 8
Percentage of passable judgments as a function of required speed for a representative subject in Experiment 1. Black ×’s and gray circles represent data from normal trials and catch trials (respectively) in Session A of Experiment 1. Black and gray curves are the best-fitting curves for normal and catch trials. The dotted lines indicate the critical required speed for both types of trials.
Figure 9
Figure 9
Percentage of passable judgments (A) and critical value of required speed (B) on normal and catch trials in Session A of Experiment 1. C and D show the same analysis for Session B of Experiment 1.
Figure 10
Figure 10
Percentage of passable judgments (A) and critical value of required speed (B) on normal trials in Session A versus catch trials in Session B. C and D shown the same analysis for normal trials in Session B versus catch trials in Session A.
Figure 11
Figure 11
Layout (A) and grayscale version of screenshot (B) of virtual environment used in Experiment 2. The gray area in (A) indicates the subject’s field of view at the moment that the cylinders begin moving.
Figure 12
Figure 12
Predictions for normal (A) and catch (B) trials in Experiment 2.
Figure 13
Figure 13
Schematic of design used in Experiment 2. The upper region corresponds to normal trials and the lower region corresponds to catch trials. Within each main regiong, different cells correspond to different conditions. Conditions in which visual gain was set to 1.0× (i.e., normal trials in Session A and catch trials in Session B) are shaded black, and conditions in which visual gain was set to 1.5× are shaded white. The subset of normal trials with initial conditions that match the initial conditions on catch trials are enclosed by a solid white line.

References

    1. Arzamarski R, Harrison SJ, Hajnal A, Michaels CF. Lateral ball interception: hand movements during linear ball trajectories. Experimental Brain Research. 2007;177(3):312–323. - PubMed
    1. Bastin J, Fajen BR, Montagne G. Controlling speed and direction during interception: an affordance-based approach. Experimental Brain Research. 2010;201(4):763–780. - PubMed
    1. Bootsma RJ, Craig CM. Global and local contributions to the optical specification of time to contact: observer sensitivity to composite tau. Perception. 2002;31(8):901–924. - PubMed
    1. Bootsma RJ, Peper L. Predictive visual information sources for the regulation of action with special emphasis on hitting and catching. In: Proteau LE, editor. Vision and motor control. Amsterdam: Elsevier; 1992.
    1. Bruggeman H, Zosh W, Warren WH. Optic flow drives human visuo-locomotor adaptation. Current Biology. 2007;17(23):2035–2040. - PMC - PubMed

Publication types