. 2011 Jun 10;409(3):399-414.
doi: 10.1016/j.jmb.2011.04.004. Epub 2011 Apr 9.

Mechanism of Mss116 ATPase reveals functional diversity of DEAD-Box proteins

Affiliations

Mechanism of Mss116 ATPase reveals functional diversity of DEAD-Box proteins

Wenxiang Cao et al. J Mol Biol. .

Abstract

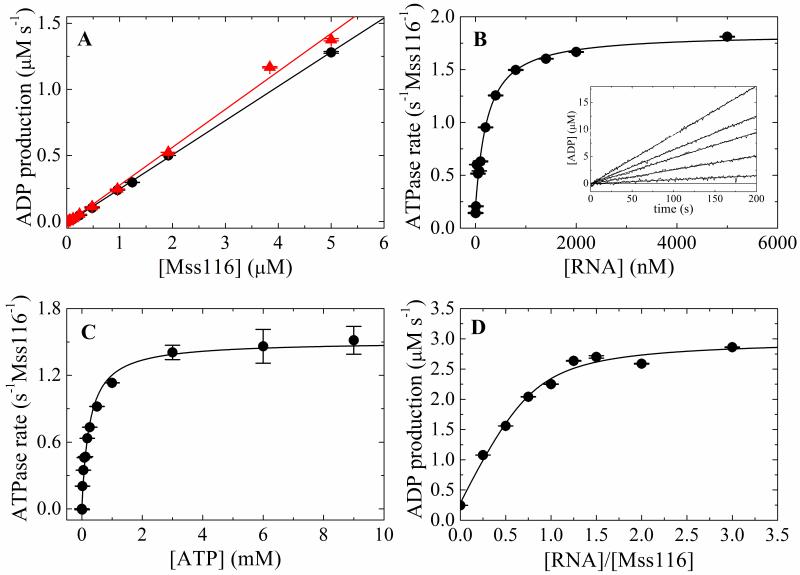
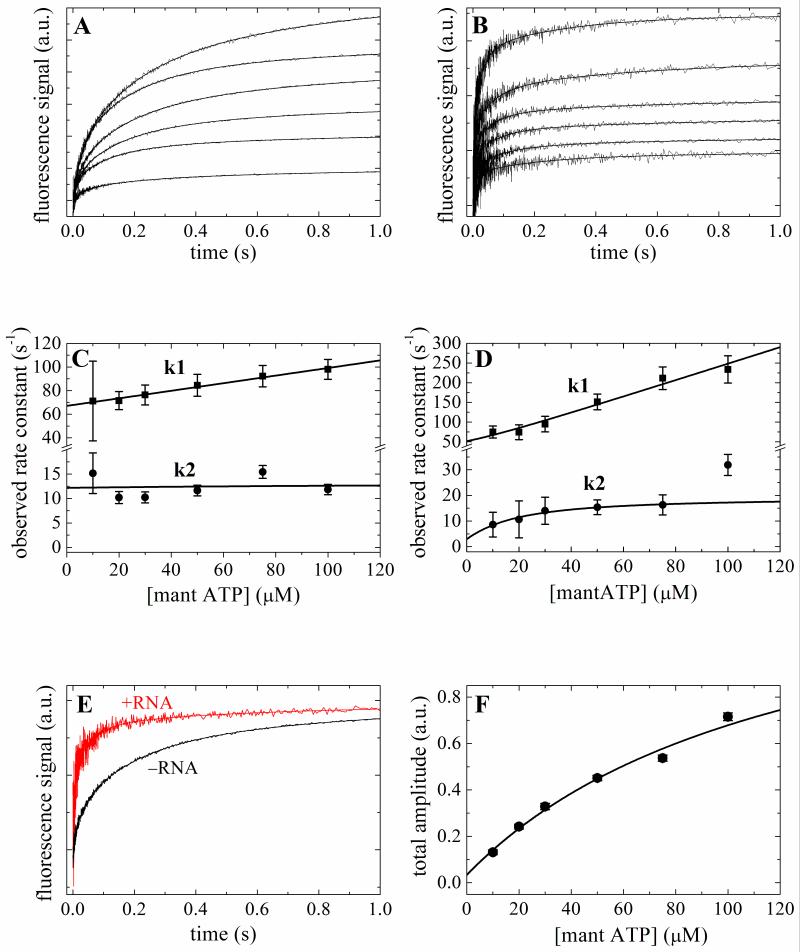
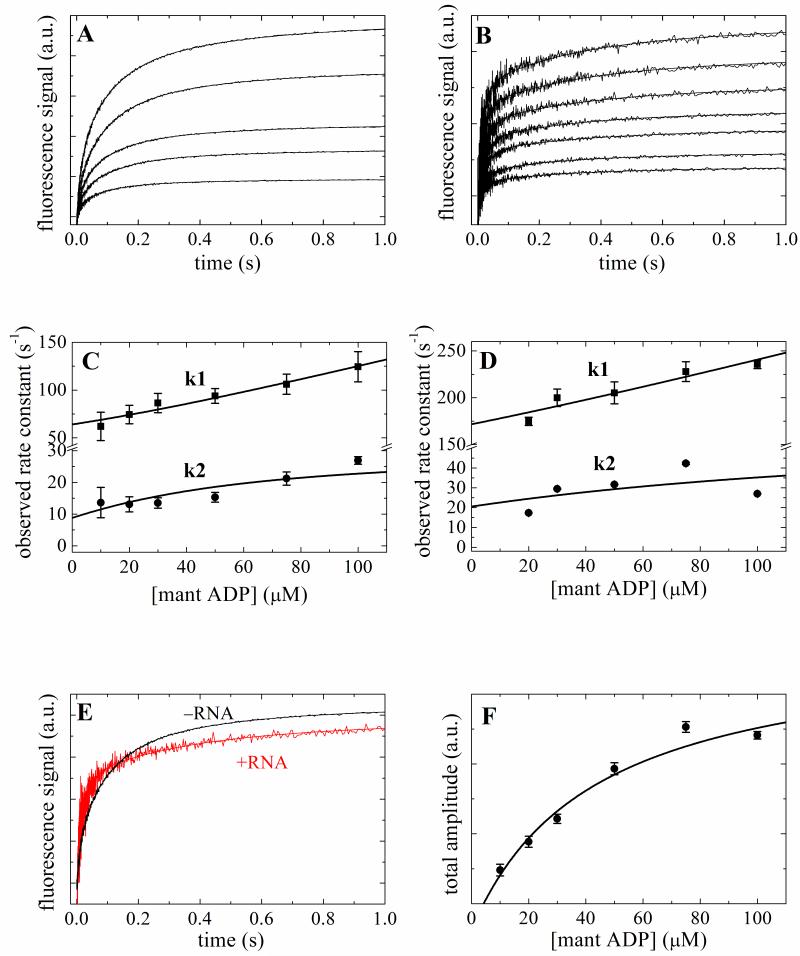
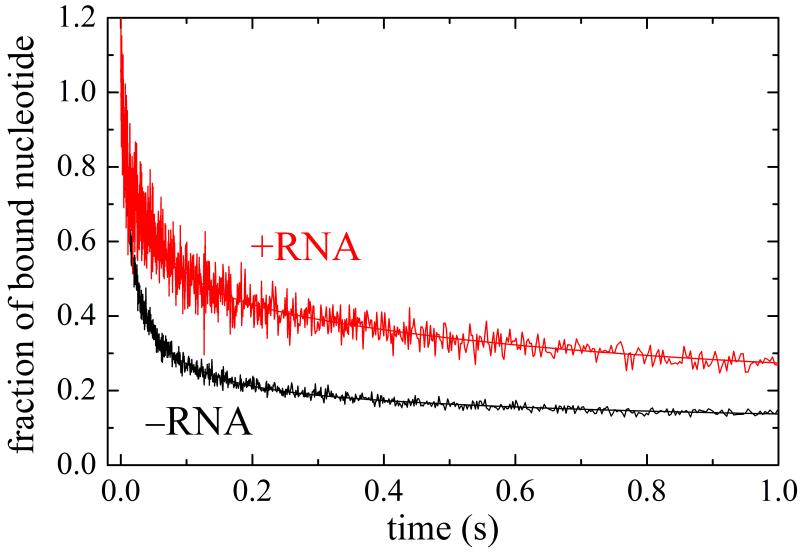
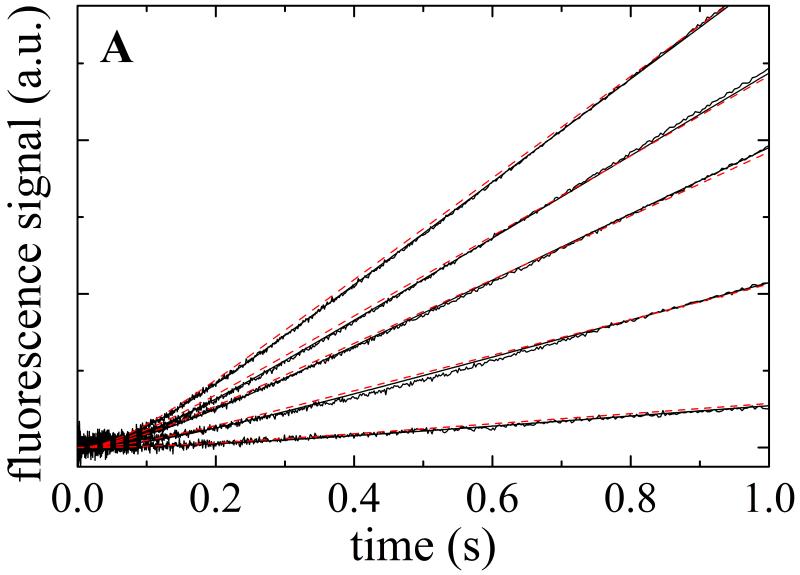
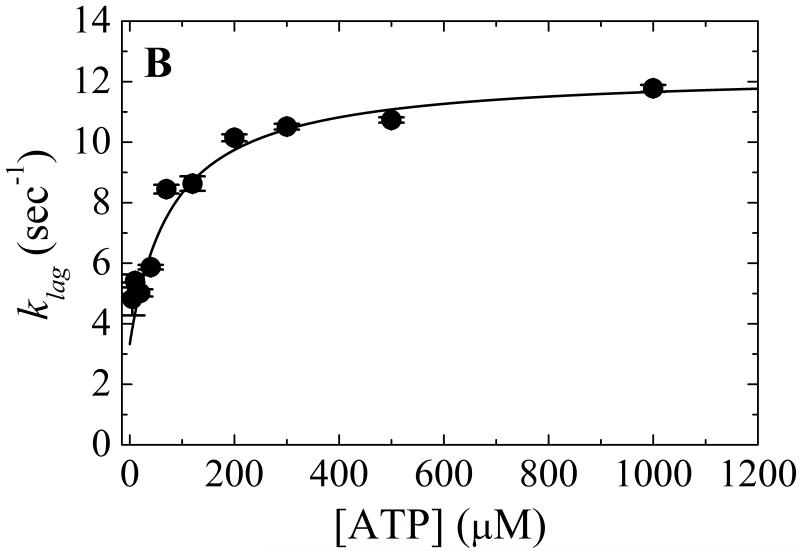
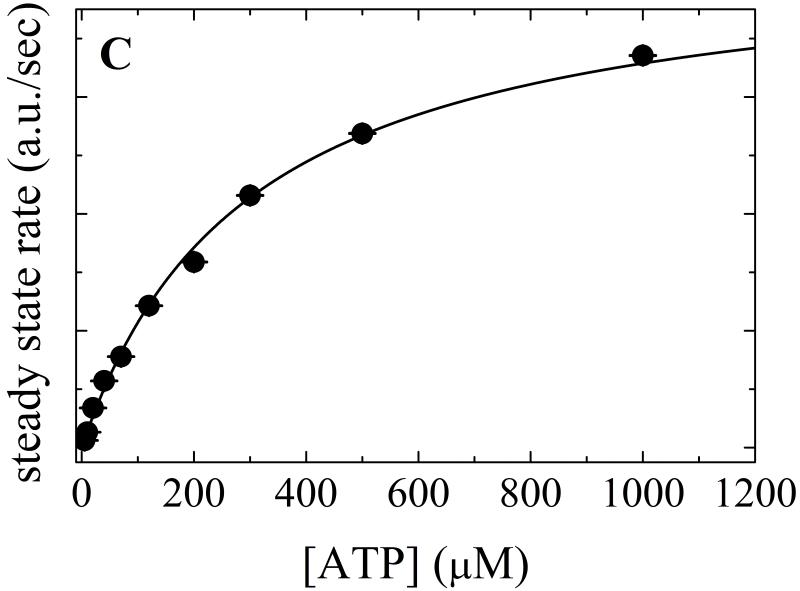
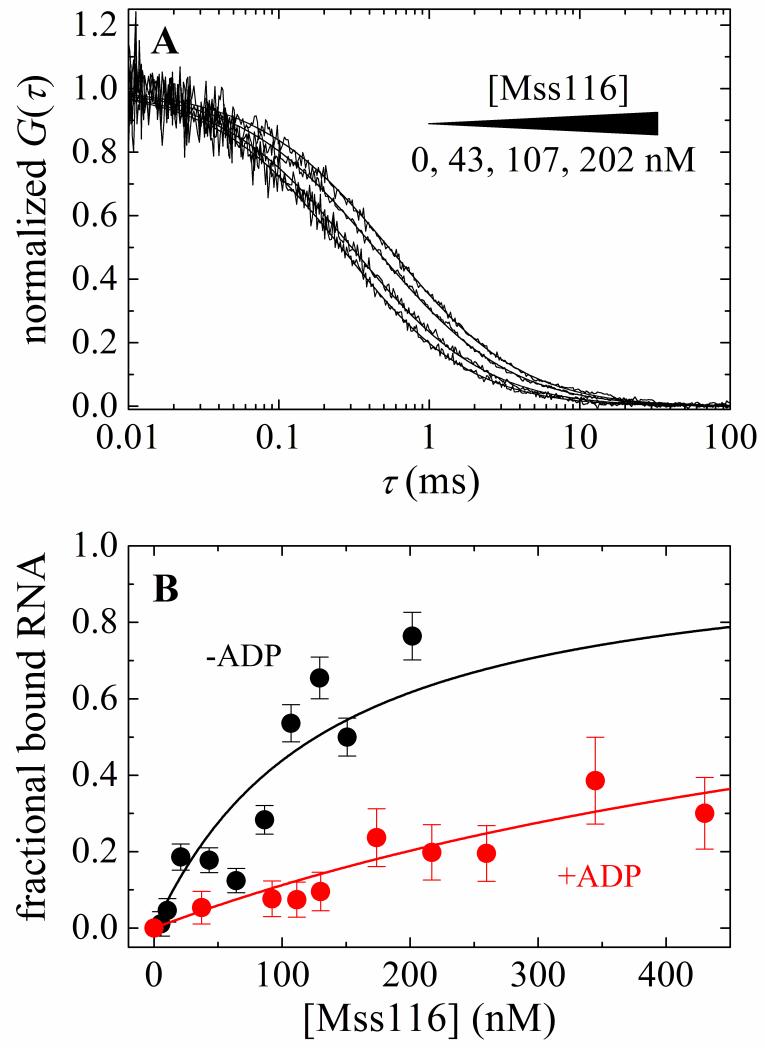
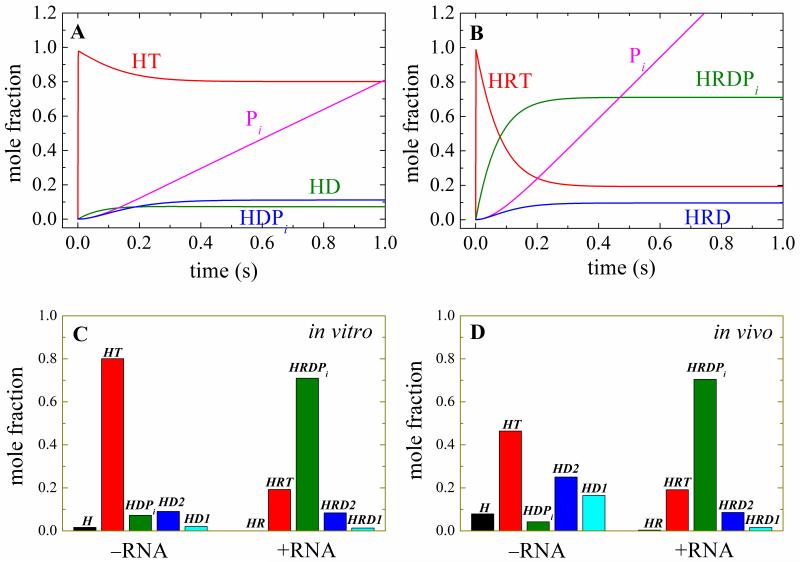
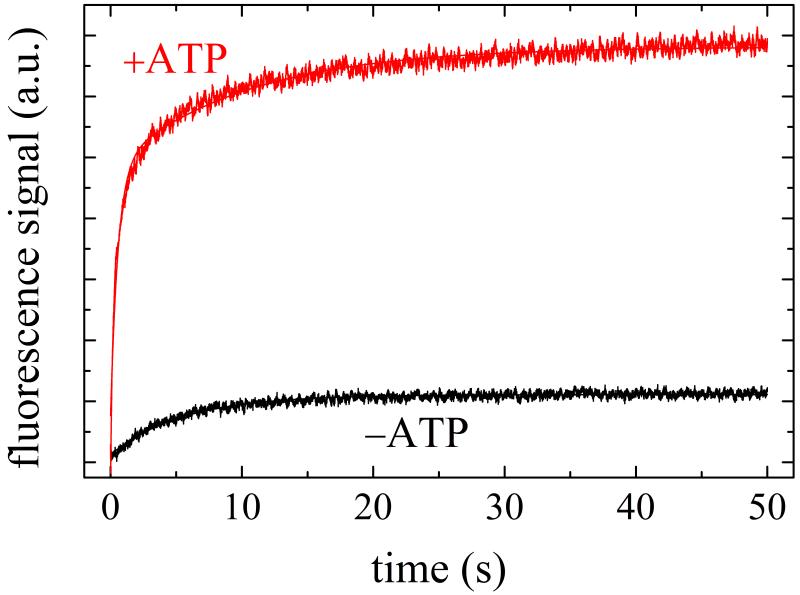
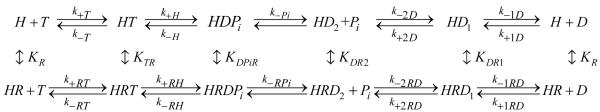
Mss116 is a Saccharomyces cerevisiae mitochondrial DEAD-box RNA helicase protein that is essential for efficient in vivo splicing of all group I and group II introns and for activation of mRNA translation. Catalysis of intron splicing by Mss116 is coupled to its ATPase activity. Knowledge of the kinetic pathway(s) and biochemical intermediates populated during RNA-stimulated Mss116 ATPase is fundamental for defining how Mss116 ATP utilization is linked to in vivo function. We therefore measured the rate and equilibrium constants underlying Mss116 ATP utilization and nucleotide-linked RNA binding. RNA accelerates the Mss116 steady-state ATPase ∼7-fold by promoting rate-limiting ATP hydrolysis such that inorganic phosphate (P(i)) release becomes (partially) rate-limiting. RNA binding displays strong thermodynamic coupling to the chemical states of the Mss116-bound nucleotide such that Mss116 with bound ADP-P(i) binds RNA more strongly than Mss116 with bound ADP or in the absence of nucleotide. The predominant biochemical intermediate populated during in vivo steady-state cycling is the strong RNA-binding Mss116-ADP-P(i) state. Strong RNA binding allows Mss116 to fulfill its biological role in the stabilization of group II intron folding intermediates. ATPase cycling allows for transient population of the weak RNA-binding ADP state of Mss116 and linked dissociation from RNA, which is required for the final stages of intron folding. In cases where Mss116 functions as a helicase, the data collectively favor a model in which ATP hydrolysis promotes a weak-to-strong RNA binding transition that disrupts stable RNA duplexes. The subsequent strong-to-weak RNA binding transition associated with P(i) release dissociates Mss116-RNA complexes, regenerating free Mss116.


Figures

Figure 1
Figure 1. Steady-state ATPase activity of Mss116
A. [Mss116]-dependence of intrinsic ATPase activity in the absence of RNA and presence of 10 mM MgATP with (filled triangles, red) and without (filled circle, black) RNase A. The slope yields a kcat of 0.26 s−1 Mss116−1 without RNase A and 0.29 s−1 Mss116−1 with RNase A. B. [RNA]-dependence of Mss116 steady-state ATPase rate in the presence of 10 mM MgATP. The solid line is the best fit to Eq. 10. The inset shows the time courses of steady state ADP production upon addition of 10 mM MgATP to a pre-equilibrated sample of 50 nM Mss116 and (lower to upper) 0, 50, 200, 400, 5000 nM RNA. The smooth lines represent the best fits to a line. C. [ATP]-dependence of Mss116 steady-state ATPase rate in the presence of 2 μM RNA. The kcat, and KM,ATP values obtained from the best fits to the hyperbolic form of the Briggs–Haldane (solid line) are listed in Table 1. D. [RNA]-dependence of Mss116 steady-state ATPase rate measured with 2 μM (>>KM,RNA) Mss116 in the presence of 2.4 mM MgATP for stoichiometry determination. The solid line is the best fit of the data to the implicit bimolecular binding equation (Supplementary material B) with the stoichiometry unconstrained during the fitting.
Figure 2
Figure 2. Kinetics of mantATP binding to Mss116 and Mss116-RNA
Time courses of fluorescence change after mixing a range of [mantATP] with 2 μM Mss116 (Panel A) or Mss116–RNA (Panel B). The smooth lines through the data are the best fits to a sum of exponentials. [mantATP]-dependence of the observed rate constants of mantATP binding to Mss116 (Panel C) or Mss116-RNA (Panel D). The solid line through the data represents the best fit to Eq. 1 . E. Comparison of the time courses of 50 μM mantATP binding to Mss116 and Mss116-RNA. F. The [mantATP]-dependence of the total fluorescence change amplitude associated with mantATP binding to Mss116. The solid line is the best fit to a hyperbola, for which the K0.5 presents the overall mantATP-Mss116 equilibrium binding constant.
Figure 3
Figure 3. Kinetics of mantADP binding to Mss116 and Mss116-RNA
Time courses of fluorescence change after mixing a range of [mantADP] with 2 μM Mss116 (Panel A) or Mss116–RNA (Panel B). The smooth lines through the data are the best fits to a sum of exponentials. [mantADP]-dependence of the observed rate constants of mantADP binding to Mss116 (Panel C) or Mss116-RNA (Panel D). The solid line through the data represents the best fit to quadratic equations Eq. 4 ; for two-step binding. E. Comparison of the time courses of 50 μM mantADP binding to Mss116 and Mss116-RNA. F. The [mantATP]-dependence of the total fluorescence change amplitude associated with mantATP binding to Mss116. The solid line is the best fit to a hyperbola, for which the K0.5 presents the overall mantADP-Mss116 equilibrium binding constant.
Figure 4
Figure 4. Kinetics of mantADP dissociation from Mss116 with and without RNA
Time courses of irreversible mantADP dissociation from Mss116 and Mss116-RNA after mixing 2 mM ADP with 2 μM Mss116 or Mss116-RNA pre-equilibrated with 50 μM mantADP. The smooth lines through the data are the best fits to a sum of exponentials.
Figure 5
Figure 5. Kinetics of transient Pi release from ATP hydrolysis by Mss116-RNA
A. Time courses of Pi release from ATP hydrolysis by Mss116-RNA (pre-equilibrated sample of 1 μM Mss116 and 2 μM RNA) after mixing with 20, 120, 300, 500 and 1000 μM MgATP (lower to upper). The smooth lines through the data are the best fits to the phosphate release equation (Eq. 7) and the red dotted lines represent simulated time courses using Scheme 1 and the rate and equilibrium constants tabulated in Table 1. B. [ATP]-dependence of the observed lag phase rate constant. The smooth line is the best fit to a hyperbola. C. [ATP]-dependence of the steady-state rate obtained from the linear regime of time courses. The solid line through the data represents the best fit to a hyperbola, yielding obtained KM,ATP of 300 μM (Table 1).
Figure 6
Figure 6. FCS measurements of equilibrium RNA binding to Mss116 and Mss116-ADP
A. Normalized autocorrelation curves of 20 nM fluorescein-labeled RNA in the presence of (from left to right) 0, 43, 107, or 202 nM Mss116. The smooth lines though the data represent a global fit to a two-species autocorrelation function (Eq. 11). B. [Mss116]- and [Mss116-ADP]-dependence of the fraction of total bound RNA obtained from global fit of autocorrelation curves of different Mss116 concentration to standard two-species autocorrelation function. The solid line through the data represents the best fit to the quadratic function for equilibrium bimolecular binding (Eq. 12) with the maximum value constrained to unity. The nucleotide-dependent RNA binding affinities are summarized in Table 1. Analysis of the average diffusion time (τaverage) yielded comparable results (Table 1).
Figure 7
Figure 7. Population and steady-state distribution of ATPase cycle biochemical intermediates
Simulated time courses of the Mss116 (Panel A) or Mss116-RNA (Panel B) populated biochemical intermediate mole fraction upon addition of 10 mM ATP and 30 μM ADP (in vitro nucleotide concentrations). C. Steady state distribution of ATPase cycle intermediates under in vitro conditions. D. Steady state distribution of ATPase cycle intermediates under Saccharomyces cerevisiae mitochondria in vivo nucleotide concentrations (1.2 mM ATP, 0.11 mM ADP and 2.7 mM Pi when grown in the presence of 110 mM glucose ).
Figure 8
Figure 8. RNA duplex unwinding by Mss116
Time courses of RNA duplex unwinding after mixing a pre-equilibrated sample of 4 μM Mss116 and 200 nM duplex RNA with 2 mM ATP (red) or buffer (black). The smooth line through the data with ATP is the best fit to a double exponential, while the smooth line through the data acquired in the absence of ATP is the best fit to a single exponential.
Scheme 1
Scheme 1

References

    1. Cordin O, Banroques J, Tanner NK, Linder P. The DEAD-box protein family of RNA helicases. Gene. 2006;367:17–37. - PubMed
    1. Pyle AM. Translocation and unwinding mechanisms of RNA and DNA helicases. Annu Rev Biophys. 2008;37:317–36. - PubMed
    1. Henn A, Cao W, Hackney DD, De La Cruz EM. The ATPase cycle mechanism of the DEAD-box rRNA helicase, DbpA. J Mol Biol. 2008;377:193–205. - PMC - PubMed
    1. Henn A, Cao W, Licciardello N, Heitkamp SE, Hackney DD, De La Cruz EM. Pathway of ATP utilization and duplex rRNA unwinding by the DEAD-box helicase, DbpA. Proc Natl Acad Sci U S A. 2010;107:4046–50. - PMC - PubMed
    1. Liu F, Putnam A, Jankowsky E. ATP hydrolysis is required for DEAD-box protein recycling but not for duplex unwinding. Proc Natl Acad Sci U S A. 2008;105:20209–14. - PMC - PubMed

Publication types

MeSH terms