. 2011 Jun 15;589(Pt 12):2963-77.
doi: 10.1113/jphysiol.2011.205542. Epub 2011 Apr 18.

Cortical feedback regulation of input to visual cortex: role of intrageniculate interneurons

Affiliations

Cortical feedback regulation of input to visual cortex: role of intrageniculate interneurons

Sigita Augustinaite et al. J Physiol. .

Abstract

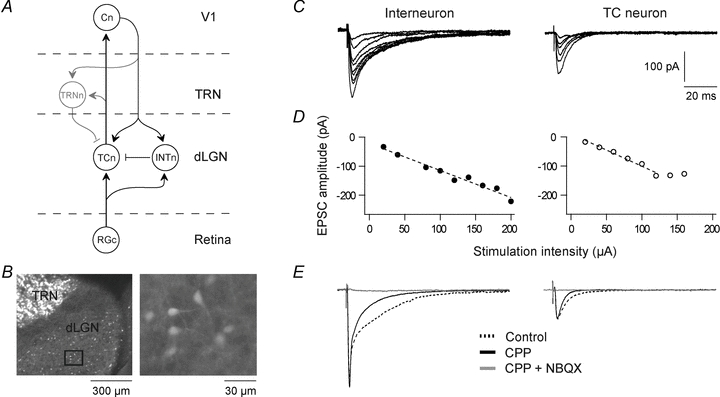
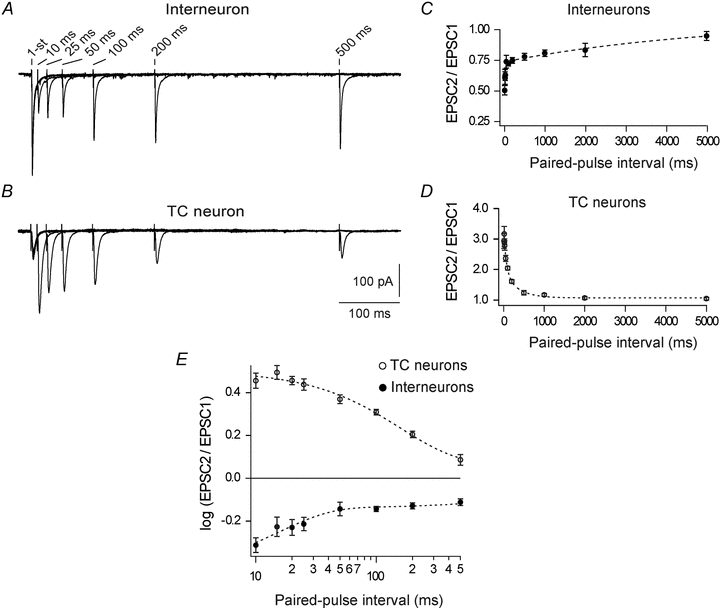
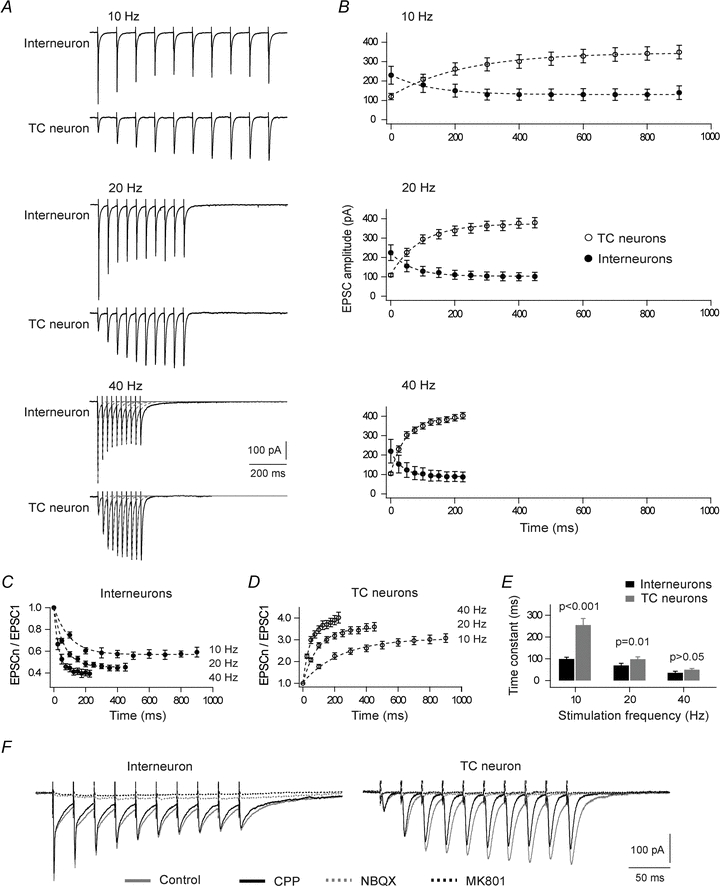
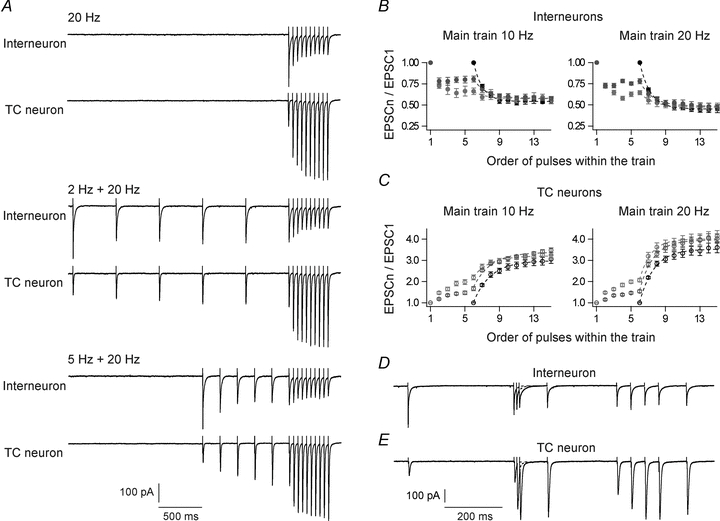
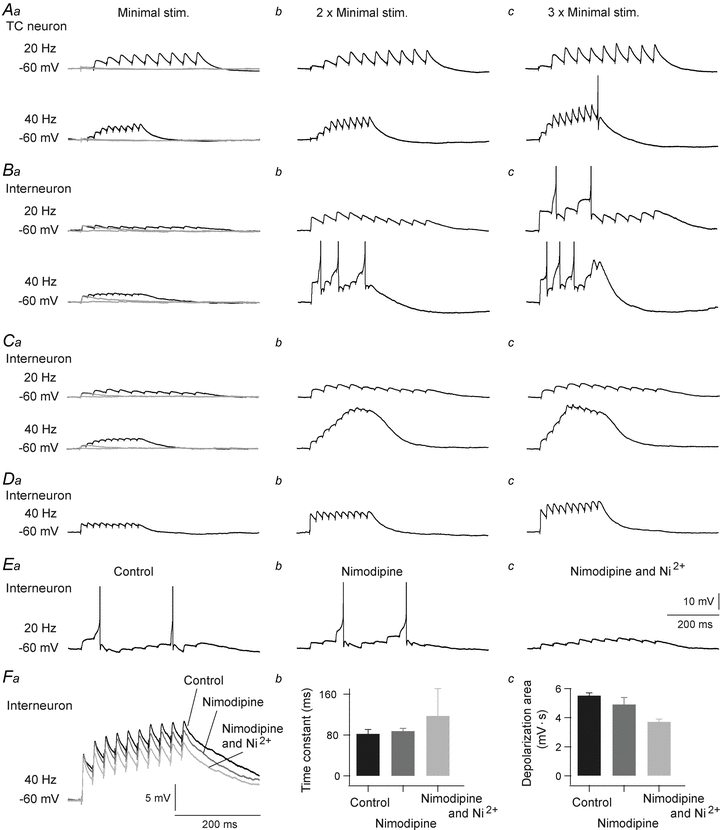
Neurons in the dorsal lateral geniculate nucleus (dLGN) process and transmit visual signals from retina to visual cortex. The processing is dynamically regulated by cortical excitatory feedback to neurons in dLGN, and synaptic short-term plasticity (STP) has an important role in this regulation. It is known that corticogeniculate synapses on thalamocortical (TC) projection-neurons are facilitating, but type and characteristics of STP of synapses on inhibitory interneurons in dLGN are unknown. We studied STP at corticogeniculate synapses on interneurons and compared the results with STP-characteristics of corticogeniculate synapses on TC neurons to gain insights into the dynamics of cortical regulation of processing in dLGN. We studied neurons in thalamic slices from glutamate decarboxylase 67 (GAD67)–green fluorescent protein (GFP) knock-in mice and made whole-cell recordings of responses evoked by electrical paired-pulse and pulse train stimulation of cortical afferents. We found that cortical excitations of interneurons and TC neurons have distinctly different properties. A single pulse evoked larger EPSCs in interneurons than in TC neurons. However, repetitive stimulation induced frequency-dependent depression of interneurons in contrast to the facilitation of TC neurons. Thus, through these differences of STP mechanisms, the balance of cortical excitation of the two types of neurons could change during stimulation from strongest excitation of interneurons to strongest excitation of TC neurons depending on stimulus frequency and duration, and thereby contribute to activity-dependent cortical regulation of thalamocortical transmission between net depression and net facilitation. Studies of postsynaptic response patterns of interneurons to train stimulation demonstrated that cortical input can activate different types of neuronal integration mechanisms that in addition to the STP mechanisms may change the output from dLGN. Lower stimulus intensity, presumably activating few cortical afferents, or moderate frequencies, elicited summation of graded EPSPs reflecting synaptic depression. However, strong activation through higher intensity or frequency, elicited complex response patterns in interneurons caused at least partly by activation of calcium conductances.


Figures

Figure 1
Figure 1. Cortical excitation of dLGN neurons
A, schematic wiring diagram of the geniculate circuit. RGc, retinal ganglion cell; TCn, thalamocortical neuron; INTn, intrinsic interneuron; TRNn, neuron of thalamic reticular nucleus; Cn, cortical neuron of primary visual area V1; arrow, excitatory connection; bar, inhibitory connection. B, section of a fixated brain slice prepared from GAD67-GFP (Δneo) mice. Left, dorsal part of dLGN and TRN with GFP-GAD67-positive cells (light grey). Right, enlargement of the area of dLGN marked by the square on the left. C, EPSCs evoked by electrical single pulse stimulation of corticogeniculate afferents at different stimulus intensities in an interneuron and a TC neuron. In all experiments GABA receptors were blocked by picrotoxin (50 μm) and CGP54626 (10 μm) added to the perfusion solution. D, amplitudes of EPSCs plotted as a function of stimulus intensity for the same neurons as in C. E, EPSCs mediated by ionotropic non-NMDA and NMDA receptors in an interneuron and a TC neuron. Dotted traces, responses in the control condition when GABAergic synaptic inputs were blocked by picrotoxin and CGP54626. Continuous traces, responses mediated by the non-NMDA component after application of 15 μm CPP. Grey traces, responses after application of 10 μm NBQX in addition to CPP. Membrane potential was kept at −60 mV. The same holding potential applies also to recordings in other figures.
Figure 2
Figure 2. Cortical feedback depresses interneurons but facilitates TC neurons
A and B, EPSCs evoked in an interneuron (A) and a TC neuron (B), by paired-pulse stimulation of corticogeniculate afferents. For each neuron traces obtained at different inter-pulse intervals are superimposed; inter-pulse intervals are indicated above the 2nd pulse in each trace. Each trace is an average of five trials with 10 s inter-trial intervals. Notice that the EPSC to the 2nd pulse decreased with shortening of the inter-pulse interval for the interneuron, demonstrating paired-pulse depression, but increased for the TC neuron, demonstrating paired-pulse facilitation. C, average paired-pulse depression ratio in interneurons (n = 12). D, average paired-pulse facilitation ratio in TC neurons (n = 11). E, paired-pulse effects for the same interneurons as in C (filled spots) and the TC neurons in D (open spots) re-plotted on double logarithmic axes. Dotted curves, double exponential functions fitted to the data. Notice the distinct temporal characteristics of short-term plasticity at corticothalamic synapses on interneurons (τf= 16.5 ± 1.14 ms, τs= 5.1 ± 1.3 s) and TC neurons (τf= 66.3 ± 22.1 ms, τs= 0.3 ± 0.1 s). Here and in other figures with average data, data points are mean ± SEM; the non-NMDA component was isolated by application of 15 μm CPP.
Figure 3
Figure 3. Short-term plasticity evoked by pulse train stimulation of corticogeniculate afferents
A, changes of EPSC amplitude during the trains for an interneuron (upper trace at each frequency) and a TC neuron (lower trace at each frequency). Each trace is an average of five trials with 30 s inter-trial intervals. B, averaged amplitudes of EPSCs of interneurons (filled spots, n = 11) and TC neurons (open spots, n = 13) evoked by trains of different frequencies. C and D, amplitudes of EPSCs to the successive pulses in the train, normalized to the amplitude of the first pulse, for corticogeniculate synapses of interneurons (C, n = 11), and TC neurons (D, n = 13); same data set as in B. Dotted curves, exponential functions fitted to the data. E, the time constants of exponentials describing the time course of accumulation of depression of interneurons (black bars) and facilitation of TC neurons (grey bars) at the different train frequencies. F, the postsynaptic response to the 40 Hz train was blocked by application of the ionotropic receptor antagonists CPP (15 μm), NBQX (10 μm) and MK801 (50 μm).
Figure 4
Figure 4. Influence of preceding activity on responses to pulse train stimulation
A, results from experiments with two-part stimuli showing effects of a pre-train on the response to a 20 Hz main train stimulus. Top, control without pre-train. Middle, pre-train consisting of five pulses at 2 Hz. Bottom, pre-train at 5 Hz. Interneuron, upper trace at each stimulation condition; TC neuron, lower trace at each stimulation condition. Each trace is an average of five trials with 60 s inter-trial intervals. B and C, amplitudes of EPSCs in interneurons (B, n = 8) and TC neurons (C, n = 9) evoked by successive pulses in the two-part train, normalized to the amplitude of the first EPSC. In the left panels in B and C a main train of 10 Hz was used, in the right panels, a main train of 20 Hz was used. Black circles, responses in the control condition without pre-train; dark grey circles, responses with 2 Hz pre-train; light grey circles, responses with 5 Hz pre-train. The curves are single exponential functions fitted to the responses to the main train. D and E, responses evoked by pulse train stimuli with irregular inter-pulse intervals. D, response of an interneuron. E, response of a TC neuron. The inter-pulse intervals varied between 10 and 380 ms. Each trace is an average of five trials with 60 s inter-trial intervals.
Figure 5
Figure 5. Depolarization evoked by train-stimulation of corticogeniculate fibres
A, summation of depolarization in a TC neuron during 20 Hz (upper traces) and 40 Hz (lower traces) stimulation. Aa, response evoked by the minimal stimulation current; Ab, response evoked by stimulation current twofold larger than the minimal; Ac, response evoked by stimulation current threefold larger than the minimal. The minimal stimulation was selected such that the single pulse elicited clear EPSP (traces in grey). B, C and D, summation of depolarization in 3 different interneurons in the same stimulation conditions as in A (only responses to 40 Hz trains are shown in D). E, results from an interneuron where stimulation strength was adjusted to a level where the complex response pattern was elicited (Ea, control), and effects of nimodipine (Eb; 50 μm), and nimodipine plus Ni2+ (Ec; 0.4 mm), were tested. F, summation of depolarization in interneurons when voltage-gated Na+ channels were blocked with QX222 (5 mm); black, control condition; dark grey with nimodipine (50 μm); light grey with nimodipine and Ni2+ (0.4 mm). Fa, traces from a representative interneuron. Fb, the time constants of exponentials for the build-up of depolarization during 40 Hz trains. Fc, depolarization integrated over the response period to a 40 Hz train. Action potentials truncated at −20 mV.

References

    1. Abbott LF, Regehr WG. Synaptic computation. Nature. 2004;431:796–803. - PubMed
    1. Acuna-Goycolea C, Brenowitz SD, Regehr WG. Active dendritic conductances dynamically regulate GABE release from thalamic interneurons. Neuron. 2008;57:420–431. - PubMed
    1. Ahlsén G, Lindström S, Lo FS. Interaction between inhibitory pathways to principal cells in the lateral geniculate nucleus of the cat. Exp Brain Res. 1985;58:134–143. - PubMed
    1. Alexander GM, Fisher TL, Godwin DW. Differential response dynamics of corticothalamic glutamatergic synapses in the lateral geniculate nucleus and thalamic reticular nucleus. Neuroscience. 2006;137:367–372. - PubMed
    1. Andolina IM, Jones HE, Wang W, Sillito AM. Corticothalamic feedback enhances stimulus response precision in the visual system. Proc Natl Acad Sci U S A. 2007;104:1685–1690. - PMC - PubMed

Publication types