. 2011 Jun 10;286(23):20297-312.
doi: 10.1074/jbc.M110.163063. Epub 2011 Apr 18.

Mitochondrial dysfunction impairs tumor suppressor p53 expression/function

Affiliations

Mitochondrial dysfunction impairs tumor suppressor p53 expression/function

Shannon Compton et al. J Biol Chem. .

Abstract

Recently, mitochondria have been suggested to act in tumor suppression. However, the underlying mechanisms by which mitochondria suppress tumorigenesis are far from being clear. In this study, we have investigated the link between mitochondrial dysfunction and the tumor suppressor protein p53 using a set of respiration-deficient (Res(-)) mammalian cell mutants with impaired assembly of the oxidative phosphorylation machinery. Our data suggest that normal mitochondrial function is required for γ-irradiation (γIR)-induced cell death, which is mainly a p53-dependent process. The Res(-) cells are protected against γIR-induced cell death due to impaired p53 expression/function. We find that the loss of complex I biogenesis in the absence of the MWFE subunit reduces the steady-state level of the p53 protein, although there is no effect on the p53 protein level in the absence of the ESSS subunit that is also essential for complex I assembly. The p53 protein level was also reduced to undetectable levels in Res(-) cells with severely impaired mitochondrial protein synthesis. This suggests that p53 protein expression is differentially regulated depending upon the type of electron transport chain/respiratory chain deficiency. Moreover, irrespective of the differences in the p53 protein expression profile, γIR-induced p53 activity is compromised in all Res(-) cells. Using two different conditional systems for complex I assembly, we also show that the effect of mitochondrial dysfunction on p53 expression/function is a reversible phenomenon. We believe that these findings will have major implications in the understanding of cancer development and therapy.


Figures
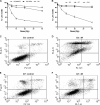
FIGURE 1.
FIGURE 1.
Protection of Res cells from γIR-induced death. Cells were seeded 24 h prior γIR to reach ∼70% confluency, and the level of cell death was monitored by flow cytometry (see “Experimental Procedures”). A, relative γIR sensitivities of Res cells due to mutations in the MWFE subunit of complex I. B2-MWFE cells, Res+ cells; B2-S55A cells, Res, ∼50% less complex I; and B2 cells, Res, lack complex I. B, relative γIR sensitivity of other Res cells. G3 cells, Res+ cells; G18 cells, Res, lack complex I due to the absence of the ESSS subunit; and G7 cells, Res due to the absence of all mtDNA-encoded proteins. See Table 1 for details of each cell line. The percent live cells 24 h post-γIR with different doses (0, 5, 10, 20, and 40 Gy) are reported. C–F, representative flow cytometry data showing the propidium iodide (FL2-H) and annexin V (FL1-H) signals for the Res+ G3 (C, control; D, 40 Gy γIR-treated) and Res G7 (E, control; F, 40 Gy γIR-treated) cells.
FIGURE 2.
FIGURE 2.
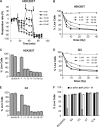
Effect of complex I inhibition with rotenone on the γIR sensitivity of Res+ cells. A, rotenone titration of the basal and maximal (FCCP-stimulated) respiration rates of HEK293T cells using in situ respirometry (see “Experimental Procedures”). Sequential additions (to block mitochondrial respiration completely) were made as follows: arrow A, rotenone (0, 5, 10, 20, or 50 nm); arrow B, 3 μm FCCP; and arrow C, 1 μm rotenone with 2 μm myxothiazol. The respiration rate just before rotenone addition was set to “0” for comparing % modulation following each addition. B and D, dose-dependent protection of HEK293T (B) and G3 (D) cells by rotenone added 1 h prior to 40 Gy γIR. C and E, loss of protection offered by rotenone to HEK293T (C) and G3 (E) cells when added after γIR treatment. Rotenone was added either before (−1, 1 h after) or 1–20 after (+1, 1 h; +2, 2 h; +4, 4 h; +8, 8 h; +20, 200 h after) 40 Gy γIR treatment. Cell death was monitored at 24 h post-IR. F, relative level of rotenone-mediated protection in Res+ cell (B2-MWFE, G3) compared with that observed by genetic mutations in Res (B2, G7, and G18) cells following 40 Gy γIR.
FIGURE 3.
FIGURE 3.
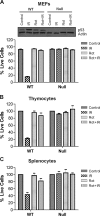
p53 dependence of γIR sensitivity and the relative protection by rotenone compared with complete p53 loss. Cell death was assayed 24 h post-γIR in the wild type (p53+/+) and null (p53−/−) cells derived from C57BL/6 mice. A, MEFs. Top panel, Western blot analysis of the total p53 protein. Actin was monitored as loading control. Bottom panel, relative levels of death in p53+/+ and p53−/− MEFs induced by 40 Gy γIR. B, p53-dependent 1 Gy γIR-induced death in thymocytes. C, p53-dependent 1 Gy γIR-induced death in splenocytes. Because of the differences in survival between p53+/+ and p53−/− thymocytes and lymphocytes following isolation, their control values were set to 100%. Note that thymocytes and splenocytes are very sensitive to radiation. Thus, they were treated with 1 Gy γIR. Control, untreated cells; IR, γ-irradiated; Rot, 50 nm rotenone treated, Rot+IR, rotenone (50 nm) plus IR-treated.
FIGURE 4.
FIGURE 4.
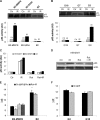
Relative levels of p53 protein expression and its activity in Res cells. A, effects of complex I deficiencies because of mutations in the MWFE subunit. Top panel, Western blot analysis of the total p53 protein using the DO1 antibody. Actin was monitored for equal protein loading. Bottom panel, relative p53 activity. B, effects of blocked mitochondrial protein in G7 cells or another complex I deficiency because of the absence of ESSS subunit in G18 cells. G3 cells are wild type controls. Top panel, Western blot analysis of the total p53 protein. Bottom panel, relative p53 activity. C, rotenone addition 1 h before 10 Gy γIR-blocked p53 activity induction in Res+ cells. D, effect of rotenone on p53 protein level in HEK293T cells. E and F, real time quantitative PCR-based analysis of the p21 expression in B2-MWFE versus B2 cells (E) and in G3 versus G18 (F) cells following 40 Gy γIR. Lower ΔCt means higher expression and vice versa. Cells were harvested 6 h post-γIR for the assays as described under “Experimental Procedures.” Note that for activity assays 10 Gy (instead of 40 Gy) γIR was used to avoid any detrimental effects on the transcription due to DNA damage. The values for B2-MWFE, G3, and HEK293T controls were set to “1” for determining the relative activities of the corresponding Res and rotenone-treated cells. See supplemental Table S1 for the actual values. Ctr, untreated cells; IR, γIR-treated (10 Gy) cells; Rot, 50 nm rotenone treated; Rot+IR, rotenone plus γIR-treated. Standard deviations are shown. *, significant from the untreated B2-MWFE control (Ctr) at p < 0.001.
FIGURE 5.
FIGURE 5.
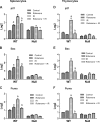
Effect of rotenone on p53 transcriptional activity. The activity of p53 was monitored by measuring the mRNA expression of p53 target genes p21, Bax, and Puma following 1 Gy γIR in the presence and absence of rotenone. Splenocytes (A–C) and thymocytes (D–F) isolated from p53+/+ (WT) and p53−/− (Null) C57BL/6 mice were harvested 6 h post-γIR to determine the relative expression of p21 (A and D), Bax (B and E) and Puma (C and F) by real time PCR as described under “Experimental Procedures.” Statistical significance was determined by one way analysis of variance. Significant differences (p < 0.001) between the controls versus treated (rotenone, IR), and IR versus IR + rotenone are denoted with a and b, respectively.
FIGURE 6.
FIGURE 6.
Effects of complex I deficiencies on p53 expression/function are reversible. A–C, restoration of the p53 protein expression (A), γIR-sensitivity (B), and activity (C) in B2-MWFEi cells following the induction of MWFE subunit. D–F, restoration of the p53 protein expression (D), γIR sensitivity (E), and activity (F) in G18-ESSSi cells following the induction of ESSS subunit. The expressions of the MWFE and ESSS were induced by treating the B2-MWFEi and G18-ESSSi cells, respectively, with 1 μg/ml Dox for 48 h. Then the Dox was removed for 24 h prior to γIR treatment to eliminate its potential inhibitory effects on the mitochondrial protein synthesis. The MWFE and ESSS proteins were detected using the anti-HA epitope antibody. The p53 was detected with the DO1 antibody, and the actin served as the loading control. As expected, the p53 protein in G18-ESSSi cells was present in both the absence and presence of Dox. Relative p53 activity is shown in the absence (−Dox) and presence (+Dox) of the MWFE and ESSS protein expression. The assays were performed in quadruplicate per condition within each experiment, and the values for Dox-treated controls were set to 1. Ctr, controls; IR, γIR-treated. The Western blots, cell death, and activity data were obtained from the same set of cells. See “Experimental Procedures” for details of the assays.
FIGURE 7.
FIGURE 7.
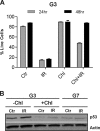
Effect of chloramphenicol on γIR sensitivity of cells. A, protection of the γIR-sensitive G3 (Res+) cells by the chloramphenicol, a mitochondrial protein synthesis inhibitor. Cells were pretreated with 50 μg/ml chloramphenicol for 24 and 48 h and then γIR-treated (40 Gy) with the chloramphenicol present in the medium. Cell death was assayed 24 h later. B, chloramphenicol addition (48 h prior to γIR) reduced the p53 protein level in G3 cells comparable with that seen in G7 cells. The total p53 level was monitored using the DO1 antibody, while using actin as the loading control. Western blot for G3 cells corresponding to the 48 h data set in A are shown. Ctr, untreated controls; IR, γIR-treated; Chl, chloramphenicol treated; Chl+IR, chloramphenicol plus γIR-treated.
FIGURE 8.
FIGURE 8.
Ectopic expression of p53 does not restore the γIR sensitivity in Res cells. A, relative rescues of the γIR sensitivity in Res (B2 and G18) cells and p53−/− MEFs. GFP positive % live cells are reported with nonirradiated controls set to 100%. B, relative level of p53 activity rescue in Res (B2 and G18) cells and p53−/− MEFs. Transiently (24 h) co-transfected cells with the p53-GFP and p53 activity reporter were γIR-treated and analyzed for relative levels of death as described under “Experimental Procedures.” Cells were treated in triplicate from which the two sets were used for the determination of cell death (24 h post-γIR (40 Gy), A), and the remaining set was used for the p53 activity assay (6 h post-γIR (10 Gy), B). The p53−/− MEFs from C57BL/6 mice were used as positive controls to demonstrate the rescue of the γIR sensitivity and p53 activity. Ctr, non-γIR-treated transfected cells; IR, γIR-treated transfected cells.
FIGURE 9.
FIGURE 9.
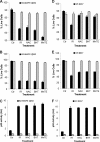
Effect of antioxidants on γIR sensitivity and p53 activity. A–C, antioxidant effects on γIR sensitivity (A and B) and p53 activity (C) of B2-MWFE versus B2 cells. D–F, antioxidant effects on γIR sensitivity (D and E) and p53 activity (F) of G3 versus G18 cells. Cells were treated with 30 mm NAC, 200 μm BHT, or 25 μm MnTE-2-PyP 2.5 h before γIR. Cell death was monitored 24 h post-IR at 10 Gy (A and D) or 40 Gy (B and E). p53 activity was monitored 6 h post-IR as described under “Experimental Procedures.”

References

    1. Brandon M., Baldi P., Wallace D. C. (2006) Oncogene 25, 4647–4662 - PubMed
    1. Wallace D. C. (2005) Annu. Rev. Genet. 39, 359–407 - PMC - PubMed
    1. Modica-Napolitano J. S., Kulawiec M., Singh K. K. (2007) Curr. Mol. Med. 7, 121–131 - PubMed
    1. Tucker E. J., Compton A. G., Thorburn D. R. (2010) Curr. Neurol. Neurosci. Rep. 10, 277–285 - PubMed
    1. Gasparre G., Porcelli A. M., Bonora E., Pennisi L. F., Toller M., Iommarini L., Ghelli A., Moretti M., Betts C. M., Martinelli G. N., Ceroni A. R., Curcio F., Carelli V., Rugolo M., Tallini G., Romeo G. (2007) Proc. Natl. Acad. Sci. U.S.A. 104, 9001–9006 - PMC - PubMed

Publication types

MeSH terms

Substances

Associated data