. 2011 Apr 18;193(2):333-46.
doi: 10.1083/jcb.201011039.

A 3D analysis of yeast ER structure reveals how ER domains are organized by membrane curvature

Affiliations

A 3D analysis of yeast ER structure reveals how ER domains are organized by membrane curvature

Matt West et al. J Cell Biol. .

Abstract

We analyzed the structure of yeast endoplasmic reticulum (ER) during six sequential stages of budding by electron tomography to reveal a three-dimensional portrait of ER organization during inheritance at a nanometer resolution. We have determined the distribution, dimensions, and ribosome densities of structurally distinct but continuous ER domains during multiple stages of budding with and without the tubule-shaping proteins, reticulons (Rtns) and Yop1. In wild-type cells, the peripheral ER contains cytoplasmic cisternae, many tubules, and a large plasma membrane (PM)-associated ER domain that consists of both tubules and fenestrated cisternae. In the absence of Rtn/Yop1, all three domains lose membrane curvature, ER ribosome density changes, and the amount of PM-associated ER increases dramatically. Deletion of Rtns/Yop1 does not, however, prevent bloated ER tubules from being pulled from the mother cisterna into the bud and strongly suggests that Rtns/Yop1 stabilize/maintain rather than generate membrane curvature at all peripheral ER domains in yeast.


Figures

Figure 1.
Figure 1.
3D structural analysis of ER morphology. (A and B) 2D tomograph derived from a 200-nm-thick section shows the NE (orange), pmaER, cecER, tubER, and Golgi (pink; A) and corresponding 3D model (of A) shows all ER domains in a wt yeast cell (bud size = 665 nm; B). The blue shade is the PM. N is the nucleus. Black holes on the NE are nuclear pores. The orange arrow points to a more tubular pmaER structure, whereas the blue arrow points to a fenestrated cisternal pmaER. (C–E) 2D tomograph of cecER (C), tubER (D), and pmaER (with white and black arrows pointing at PM and ER membranes, respectively; E). Note that the black dots are ribosomes (red arrow in C). (F) Range of measured distances between the pmaER and PM membranes (e.g., from black to white arrows in E). (G) The percentage of ribosomes bound to the cytosolic versus PM face of the pmaER demonstrates that the PM face is mostly ribosome excluded. (H) Volume/surface area ratios were calculated from our 3D models for vesicles (30 and 60 nm), tubER, pmaER, and cecER. Brackets show range of measurements, and boxes show SEM. Horizontal lines show means given above the boxes. Bars: (A, C, and D) 200 nm; (B) 100 nm; (E) 50 nm.
Figure 2.
Figure 2.
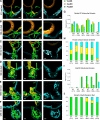
3D ER domain distribution and abundance during inheritance. (A–F) 3D models derived from 200-nm-thick section serial tomograms show ER domain organization in six different wt cells ordered by increasing bud sizes. Corresponding 2D tomographs are shown in Fig. S3 (A–F). Panels show domain distribution of all ER domains (left), cecER and tubER (yellow and green domains in middle), and pmaER alone (blue on right). (G) Graph of peripheral ER domain volumes found in reconstructed sections of cells in A–F. (H) Relative percentage of each domain in the mother cell for A–F. (I) As in G for the bud. (J) As in H for the bud ER. Bars, 200 nm.
Figure 3.
Figure 3.
Quantitative analysis of 3D ER domain dimensions. (A) Nine individual wt ER tubules were measured at 50-nm intervals along their lengths. Tubule lengths range from ∼250 to 700 nm; each tubule is shown in a different color. (B) Histogram showing the distribution of all tubER diameter measurements (n = 107 measurements taken from the nine tubules shown in A). (C) As in B for cecER thickness (n = 88 measurements). (D) As in B for pmaER thickness (n = 106 measurements). (E) Comparison of mean diameters/thickness for ER domains calculated from the data points shown in B–D. Brackets show range of measurements, and boxes show SEM. Horizontal lines show means given above the boxes.
Figure 4.
Figure 4.
3D ER domain structure in mutant Δrtn1rtn2yop1. (A and B) 3D models showing ER domain organization at two different angles of a mutant cell (mutant = Δrtn1rtn2yop1) with a 596-nm bud (A) and a 1,253-nm bud (B). (C and D) 3D model of a wt cell with a 665-nm bud (C) and a 1,255-nm bud (D) to compare with mutants. All ER domains are color coded as in Fig. 1. (E) Graph comparing the volume of each peripheral ER domain found within the reconstructed volume of the mutant mother cell (in A and B) compared with that of wt cells (C and D) with similar bud sizes. (F) As in E for the bud. (G) Comparison of mean diameters for wt and mutant ER domains showing differences in diameters/thickness that are significant for tubER and pmaER but not for NE. Horizontal lines indicate mean diameters given above the boxes. Mutant tubER mean diameter = 45.8 ± 1.6 nm versus 37.9 ± 1.1 nm for wt; mutant pmaER mean thickness = 30.3 ± 0.44 nm versus 35.6 ± 0.74 nm in wt (both are significant by unpaired t test; **, P < 0.0001). NE mutant mean thickness = 29.5 ± 0.6 nm versus 28.5 ± 0.6 nm for wt (not significantly different; P = 0.28). Brackets show range of measurements, and boxes show SEM. (H) Lengthwise diameters of nine different wt tubules and seven different mutant tubules. (I) 3D models were used to calculate the surface area of pmaER and PM to determine the percentage of the PM covered by the pmaER for wt and mutant cells. Blue and green percentages show comparisons between the wt and mutant cells with similar bud sizes. Bud sizes are indicated below each graph. Mut, mutant. SA, surface area. Bars, 200 nm.
Figure 5.
Figure 5.
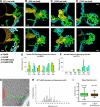
ER domain ribosome density and distribution during inheritance. (A–D) 3D models of wt cells in order of bud size (as indicated). ER domains are color coded as in Fig. 1, and ribosomes are indicated as dots in the color of the ER domain to which they are bound. (E) The number of ribosomes per surface area was calculated for each domain in each of the wt mother cells. Bud size is shown on the bottom. (F) As in E for the bud. (G) A magnified 2D tomograph shows an ER tubule that is contacting a vacuole (red). Note the apparent lack of ribosomes (black dots) on the membrane. (H) The histogram shows the range of ER tubule diameters at the positions where ribosomes are bound (n = 65). (I) The mean tubER diameter at which ribosomes are bound (37.0 ± 1.1 nm; n = 65) is compared with the overall mean tubER diameters in the tubER population (37.9 ± 1.09 nm, from Fig. 3 E; n = 107). Brackets show the ranges, and boxes show the SEM. Horizontal lines indicate the means. cyto, cytoplasmic face. Bars: (A–D) 200 nm; (G) 50 nm.
Figure 6.
Figure 6.
ER domain ribosome density without Rtns/Yop1. (A) 2D tomograph of a mutant cell with a 596-nm bud (left). Ribosomes are black dots. Note that the expansive pmaER membrane lacks tubules and fenestrations. (right) 3D model of ER domain organization in the mutant at two different angles. Peripheral ER domains are marked as in Fig. 1 with bound ribosomes indicated as dots in the color of the domain to which they are bound. (B) As in A for a mutant with a 1,253-nm bud diameter. (C) The number of ribosomes per surface area was calculated for each domain in the mother of a mutant and compared with wt cells; bud size is shown on the bottom. Domains are color coded as before with the cytoplasmic face (cyto) of pmaER in blue and PM face of pmaER in red. n = 6,511 mother ribosomes (wt = 2,044 and mutant = 4,467). (D) As in C for the bud. n = 2,029 bud ribosomes (wt = 1,727 and mutant = 302). Mut, mutant. Bars, 200 nm.
Figure 7.
Figure 7.
Dramatic changes in ER shape and curvature occur in the absence of Rtns/Yop1. (A) 3D model of ER in a wt cell with a 665-nm bud and a 1,255-nm bud that were overlayed to show the transition of ER domains into the bud. (B) As in A for corresponding mutant cells. Note the loss of membrane curvature throughout the mother of both mutant cells. However, the ER is still inherited by an Rtn/Yop1-independent process into the bud. Bars, 200 nm.

References

    1. Achleitner G., Gaigg B., Krasser A., Kainersdorfer E., Kohlwein S.D., Perktold A., Zellnig G., Daum G. 1999. Association between the endoplasmic reticulum and mitochondria of yeast facilitates interorganelle transport of phospholipids through membrane contact. Eur. J. Biochem. 264:545–553 10.1046/j.1432-1327.1999.00658.x - DOI - PubMed
    1. Anderson D.J., Hetzer M.W. 2008. Reshaping of the endoplasmic reticulum limits the rate for nuclear envelope formation. J. Cell Biol. 182:911–924 10.1083/jcb.200805140 - DOI - PMC - PubMed
    1. Audhya A., Desai A., Oegema K. 2007. A role for Rab5 in structuring the endoplasmic reticulum. J. Cell Biol. 178:43–56 10.1083/jcb.200701139 - DOI - PMC - PubMed
    1. Bernales S., McDonald K.L., Walter P. 2006. Autophagy counterbalances endoplasmic reticulum expansion during the unfolded protein response. PLoS Biol. 4:e423 10.1371/journal.pbio.0040423 - DOI - PMC - PubMed
    1. De Craene J.O., Coleman J., Estrada de Martin P., Pypaert M., Anderson S., Yates J.R., III, Ferro-Novick S., Novick P. 2006. Rtn1p is involved in structuring the cortical endoplasmic reticulum. Mol. Biol. Cell. 17:3009–3020 10.1091/mbc.E06-01-0080 - DOI - PMC - PubMed

Publication types

MeSH terms

Substances