. 2011 Apr 18;193(2):397-407.
doi: 10.1083/jcb.201004146.

Cdk2 loss accelerates precursor differentiation and remyelination in the adult central nervous system

Affiliations

Cdk2 loss accelerates precursor differentiation and remyelination in the adult central nervous system

Céline Caillava et al. J Cell Biol. .

Abstract

The specific functions of intrinsic regulators of oligodendrocyte progenitor cell (OPC) division are poorly understood. Type 2 cyclin-dependent kinase (Cdk2) controls cell cycle progression of OPCs, but whether it acts during myelination and repair of demyelinating lesions remains unexplored. Here, we took advantage of a viable Cdk2(-/-) mutant mouse to investigate the function of this cell cycle regulator in OPC proliferation and differentiation in normal and pathological conditions. During central nervous system (CNS) development, Cdk2 loss does not affect OPC cell cycle, oligodendrocyte cell numbers, or myelination. However, in response to CNS demyelination, it clearly alters adult OPC renewal, cell cycle exit, and differentiation. Importantly, Cdk2 loss accelerates CNS remyelination of demyelinated axons. Thus, Cdk2 is dispensable for myelination but is important for adult OPC renewal, and could be one of the underlying mechanisms that drive adult progenitors to differentiate and thus regenerate myelin.


Figures
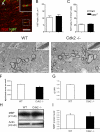
Figure 1.
Figure 1.
OPC proliferation and postnatal myelination in Cdk2−/− mice. (A) Coronal section of the CC area from P8 WT mice immunostained for NG2 and Ki67. Inset (enlarged view of the boxed region) identifies double-labeled cells. Bar, 50 µm. (B) Histogram comparing the overall density of Ki67+ cells in the CC at P8 in WT versus Cdk2−/− mice. (C) Histogram comparing the proliferative rate of NG2-expressing OPCs at P8 in WT versus Cdk2−/− mice. (D and E) Images of the CC were taken by electron microscopy from ultrathin sections of WT (D) and Cdk2−/− (E) P15 mice. The myelin sheath is represented at a higher magnification in the inset. Bar, 2 µm. (F) Histogram representing the number of myelinated axons in the CC. (G) Histogram representing g ratio in WT versus Cdk2−/− mice. (H and I) Western blot analysis of MBP quantity in WT versus Cdk2−/− mice. Actin was used as a loading control. Results are expressed as means ± SEM (error bars) and were analyzed by a t test.
Figure 2.
Figure 2.
Cell proliferation in response to demyelination in the adult brain. (A–C) 7 dpi, proliferating cells were labeled with anti-Ki67 in the ASVZ (A), the RMS (B), and in the demyelinated lesion (C) of WT (A1–C1) and Cdk2−/− P90 mice (A2–C2). Broken lines delineate the different regions. cc, corpus callosum; str, striatum; lv, lateral ventricle. Bar, 50 µm. (D) Histogram representing the number of Ki67 labeled cells per surface in each region. Results are expressed as means ± SEM (error bars; *, P < 0.05; **, P < 0.001) and were analyzed by a t test.
Figure 3.
Figure 3.
Cell cycle exit in response to demyelination in the adult brain. (A and B) 7 d after LPC injection, cells were labeled with anti-Olig2, anti-BrdU, and anti-Ki67 in the ASVZ (A) and in the demyelinated lesion (B) of WT (A1–B1) and Cdk2−/− P90 mice (A2–B2). As BrdU was injected 15 h before sacrifice, triple-immunoreactive Olig2+/BrdU+/Ki67+ cells measured the proportion of Olig2+ cycling cells while the remaining Olig2+/BrdU+/Ki67 cells indicated Olig2+ cells that exited from the cell cycle. Broken lines delineate the different regions. Arrowheads point to double-labeled cells Olig2+/BrdU+/Ki67. cc, corpus callosum; str, striatum; lv, lateral ventricle. Bar, 50 µm. (C) Histogram representing the cell cycle exit index of Olig2+ cells calculated by dividing the number of Olig2+/BrdU+/Ki67 cells by the total population of Olig2+/BrdU+ cells. Results are expressed as means ± SEM (error bars; **, P < 0.001) and were analyzed by a t test.
Figure 4.
Figure 4.
Characterization of adult ASVZ cells in which proliferation is affected by the loss of Cdk2 in response to demyelination. Characterization of proliferating cells in the ASVZ (cc, corpus callosum; str, striatum; lv, lateral ventricle) on sagittal sections obtained from WT (A1–C1) and Cdk2−/− (A2–C2) P90 mice at 7 dpi. Sections are stained with anti-Ki67 or anti-BrdU and a marker specific for different ASVZ cell types: NG2 (A1–2), Olig2 (B1–2), and Mash1 (C1–2). Broken lines delineate the ASVZ. Arrowheads point to double-labeled cells. Cells in the boxed areas are represented with threefold magnification in the inset. Bar, 50 µm. (A3–C3) Histograms representing the number of proliferating cells of each type in the ASVZ in response to demyelination. Results are expressed as means ± SEM (error bars; *, P < 0.05; **, P < 0.001) and were analyzed by a t test.
Figure 5.
Figure 5.
Oligodendrocyte proliferation in the LPC lesion. Characterization of proliferating cells in demyelinated lesions of the CC on sagittal sections obtained from WT (A1–D1) and Cdk2−/− (A2–D2) P90 mice after demyelination. Sections are stained with anti-Ki67 and a marker specific for different cell types: CD45 (A1–2) at 4 dpi, GFAP (B1–2), Olig2 (C1–2) at 7 dpi, and NG2 (D1–2) at 7 dpi and 14 dpi. Broken lines delineate the demyelinated lesion. Arrows point to double-labeled cells. Cells in the boxed areas are shown with threefold magnification in the insets. Bar, 50 µm. (A3–D3) Histograms representing the number of proliferating cells of each type in the demyelinated lesion. Results are expressed as means ± SEM (error bars; *, P < 0.05; **, P < 0.001) and were analyzed by a t test.
Figure 6.
Figure 6.
Differentiation of oligodendrocytes in the absence of Cdk2. Immunolabeling of distinct stages of oligodendroglial maturation in demyelinated lesions of the CC on sagittal sections obtained from WT (A1–C1) and Cdk2−/− (A2–C2) P90 mice at 14 dpi. Olig2 (A1–2) labels the overall oligodendroglia, whereas CC1 (B1–2) is specific for postmitotic oligodendrocytes, and NG2 (C1–2) identifies OPCs. Broken lines delineate the demyelinated lesion. Bar, 50 µm. (D–F) Histograms representing the number of different oligodendroglial cells/mm2 of demyelinated lesion at 7 (D), 14 (E), and 21 (F) dpi. Results are expressed as means ± SEM (error bars; *, P < 0.05; **, P < 0.001) and were analyzed by a t test.
Figure 7.
Figure 7.
Adult OPC differentiation in vitro. After 5 d in vitro, oligodendrocytes isolated from WT (A and C) and Cdk2−/− (B and D) P60 mice were immunostained with anti-A2B5 (A and B) and anti-O4 (C and D). Bar, 100 µm. (E) Histogram representing the percentages of the different cell types. (F) Histogram representing the proportion of O4+ cells according to their process number. Results are expressed as means ± SEM (error bars; *, P < 0.05; **, P < 0.001) and were analyzed by a t test.
Figure 8.
Figure 8.
Remyelination 14 and 21 d after LPC injection. (A) Overview of a demyelinated lesion on a semithin section. Bar, 50 µm. (B and C) Images of the demyelinated lesion were taken by electron microscopy from ultrathin sections of WT (B) and Cdk2−/− (C) P90 mice 14 dpi. Arrows point to demyelinated axons. Bar, 1 µm. (D) Histogram representing the percentage of myelinated axons compared with the total number of axons. (E) Histogram representing the g ratio in WT versus Cdk2−/− mice. Results are expressed as means ± SEM (error bars; *, P < 0.05; **, P < 0.001) and were analyzed by a t test.

References

    1. Aguirre A.A., Chittajallu R., Belachew S., Gallo V. 2004. NG2-expressing cells in the subventricular zone are type C-like cells and contribute to interneuron generation in the postnatal hippocampus. J. Cell Biol. 165:575–589 10.1083/jcb.200311141 - DOI - PMC - PubMed
    1. Aguirre A., Dupree J.L., Mangin J.M., Gallo V. 2007. A functional role for EGFR signaling in myelination and remyelination. Nat. Neurosci. 10:990–1002 10.1038/nn1938 - DOI - PubMed
    1. Atanasoski S., Boentert M., De Ventura L., Pohl H., Baranek C., Beier K., Young P., Barbacid M., Suter U. 2008. Postnatal Schwann cell proliferation but not myelination is strictly and uniquely dependent on cyclin-dependent kinase 4 (cdk4). Mol. Cell. Neurosci. 37:519–527 10.1016/j.mcn.2007.11.005 - DOI - PubMed
    1. Belachew S., Aguirre A.A., Wang H., Vautier F., Yuan X., Anderson S., Kirby M., Gallo V. 2002. Cyclin-dependent kinase-2 controls oligodendrocyte progenitor cell cycle progression and is downregulated in adult oligodendrocyte progenitors. J. Neurosci. 22:8553–8562 - PMC - PubMed
    1. Berthet C., Aleem E., Coppola V., Tessarollo L., Kaldis P. 2003. Cdk2 knockout mice are viable. Curr. Biol. 13:1775–1785 10.1016/j.cub.2003.09.024 - DOI - PubMed

Publication types

Substances