

Dose-response curve slope is a missing dimension in the analysis of HIV-1 drug resistance
- PMID: 21502494
- PMCID: PMC3088572
- DOI: 10.1073/pnas.1018360108
Dose-response curve slope is a missing dimension in the analysis of HIV-1 drug resistance
Abstract
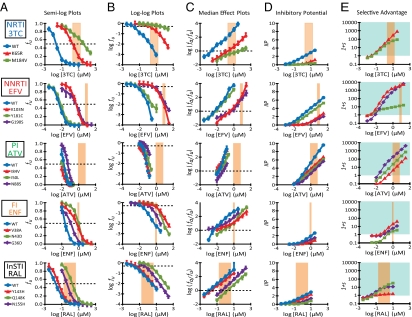
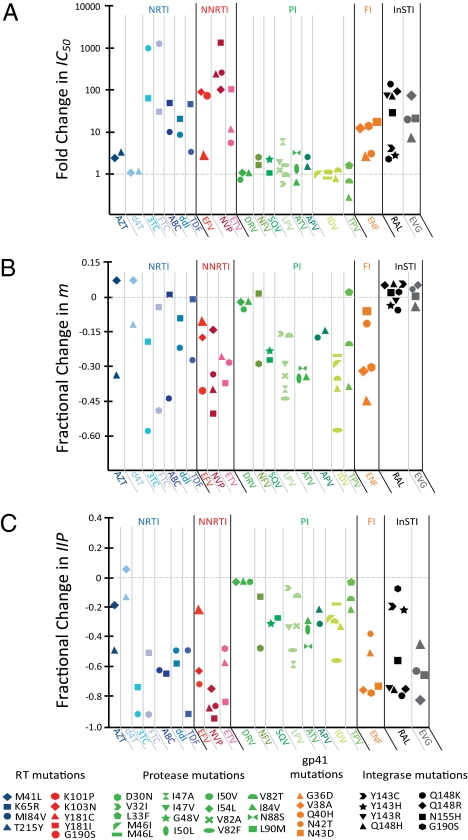
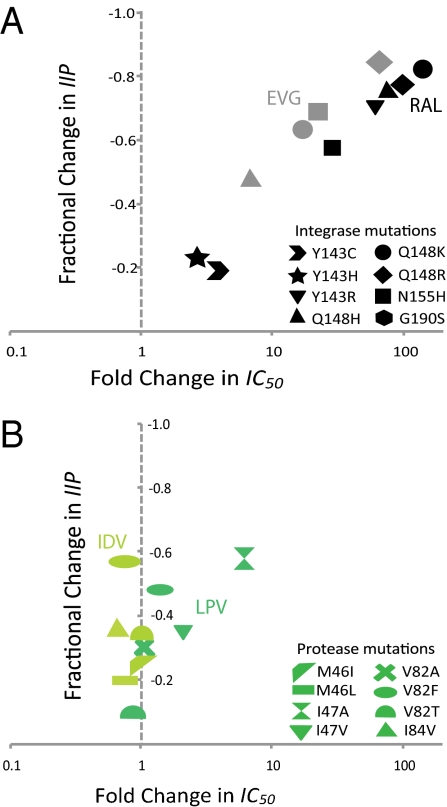
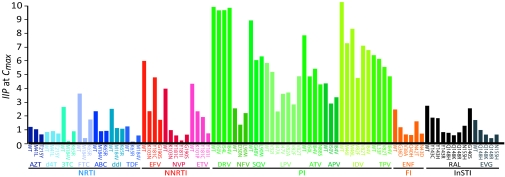
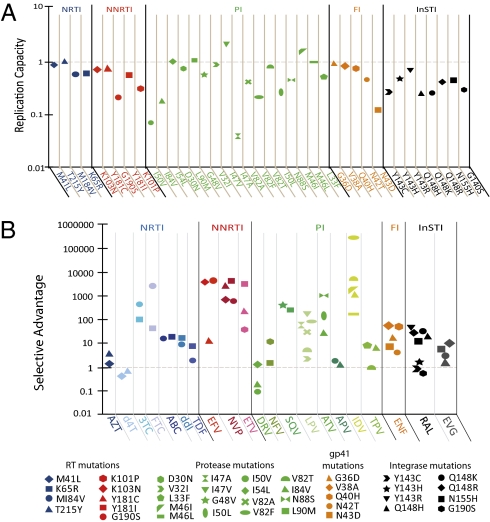
HIV-1 drug resistance is a major clinical problem. Resistance is evaluated using in vitro assays measuring the fold change in IC(50) caused by resistance mutations. Antiretroviral drugs are used at concentrations above IC(50), however, and inhibition at clinical concentrations can only be predicted from IC(50) if the shape of the dose-response curve is also known. Curve shape is influenced by cooperative interactions and is described mathematically by the slope parameter or Hill coefficient (m). Implicit in current analysis of resistance is the assumption that mutations shift dose-response curves to the right without affecting the slope. We show here that m is altered by resistance mutations. For reverse transcriptase and fusion inhibitors, single resistance mutations affect both slope and IC(50). For protease inhibitors, single mutations primarily affect slope. For integrase inhibitors, only IC(50) is affected. Thus, there are fundamental pharmacodynamic differences in resistance to different drug classes. Instantaneous inhibitory potential (IIP), the log inhibition of single-round infectivity at clinical concentrations, takes into account both slope and IC(50), and thus provides a direct measure of the reduction in susceptibility produced by mutations and the residual activity of drugs against resistant viruses. The standard measure, fold change in IC(50), does not correlate well with changes in IIP when mutations alter slope. These results challenge a fundamental assumption underlying current analysis of HIV-1 drug resistance and suggest that a more complete understanding of how resistance mutations reduce antiviral activity requires consideration of a previously ignored parameter, the dose-response curve slope.
Conflict of interest statement
The authors declare no conflict of interest.
Figures
Similar articles
-
Dose-response curve slope sets class-specific limits on inhibitory potential of anti-HIV drugs.Nat Med. 2008 Jul;14(7):762-6. doi: 10.1038/nm1777. Epub 2008 Jun 15. Nat Med. 2008. PMID: 18552857 Free PMC article.
-
The Antiviral Activity of Approved and Novel Drugs against HIV-1 Mutations Evaluated under the Consideration of Dose-Response Curve Slope.PLoS One. 2016 Mar 1;11(3):e0149467. doi: 10.1371/journal.pone.0149467. eCollection 2016. PLoS One. 2016. PMID: 26930645 Free PMC article.
-
A novel method for determining the inhibitory potential of anti-HIV drugs.Trends Pharmacol Sci. 2009 Dec;30(12):610-6. doi: 10.1016/j.tips.2009.09.003. Trends Pharmacol Sci. 2009. PMID: 19837466 Free PMC article. Review.
-
Quantitative evaluation of the antiretroviral efficacy of dolutegravir.JCI Insight. 2016 Nov 17;1(19):e90033. doi: 10.1172/jci.insight.90033. JCI Insight. 2016. PMID: 27882352 Free PMC article.
-
Review of HIV antiretroviral drug resistance.Pediatr Infect Dis J. 2008 Aug;27(8):749-52. doi: 10.1097/INF.0b013e3181846e2e. Pediatr Infect Dis J. 2008. PMID: 18664987 Free PMC article. Review. No abstract available.
Cited by
-
Evolutionary dynamics of HIV at multiple spatial and temporal scales.J Mol Med (Berl). 2012 May;90(5):543-61. doi: 10.1007/s00109-012-0892-1. Epub 2012 May 3. J Mol Med (Berl). 2012. PMID: 22552382 Free PMC article. Review.
-
Drug discovery: Rethinking cellular drug response.Nat Chem Biol. 2013 Nov;9(11):669-70. doi: 10.1038/nchembio.1365. Nat Chem Biol. 2013. PMID: 24141220 No abstract available.
-
The Utility of Efavirenz-based Prophylaxis Against HIV Infection. A Systems Pharmacological Analysis.Front Pharmacol. 2019 Mar 13;10:199. doi: 10.3389/fphar.2019.00199. eCollection 2019. Front Pharmacol. 2019. PMID: 30918485 Free PMC article.
-
Orthogonal dual reporter-based gain-of-signal assay for probing SARS-CoV-2 3CL protease activity in living cells: inhibitor identification and mutation investigation.Emerg Microbes Infect. 2023 Dec;12(1):2211688. doi: 10.1080/22221751.2023.2211688. Emerg Microbes Infect. 2023. PMID: 37144395 Free PMC article.
-
Insufficient Evidence for Rare Activation of Latent HIV in the Absence of Reservoir-Reducing Interventions.PLoS Pathog. 2016 Aug 25;12(8):e1005679. doi: 10.1371/journal.ppat.1005679. eCollection 2016 Aug. PLoS Pathog. 2016. PMID: 27560936 Free PMC article. No abstract available.
References
-
- Larder BA, Darby G, Richman DD. HIV with reduced sensitivity to zidovudine (AZT) isolated during prolonged therapy. Science. 1989;243:1731–1734. - PubMed
-
- Coffin JM. HIV population dynamics in vivo: Implications for genetic variation, pathogenesis, and therapy. Science. 1995;267:483–489. - PubMed
-
- Wei X, et al. Viral dynamics in human immunodeficiency virus type 1 infection. Nature. 1995;373:117–122. - PubMed
-
- Clavel F, Hance AJ. HIV drug resistance. N Engl J Med. 2004;350:1023–1035. - PubMed
-
- Hirsch MS, et al. International AIDS Society-USA. Antiretroviral drug resistance testing in adult HIV-1 infection: 2008 recommendations of an International AIDS Society-USA panel. Top HIV Med. 2008;16:266–285. - PubMed
Publication types
MeSH terms
Substances
Grants and funding
LinkOut - more resources
Full Text Sources
Other Literature Sources
