

Household expansion linked to agricultural intensification during emergence of Hawaiian archaic states
- PMID: 21502516
- PMCID: PMC3088592
- DOI: 10.1073/pnas.1103805108
Household expansion linked to agricultural intensification during emergence of Hawaiian archaic states
Abstract
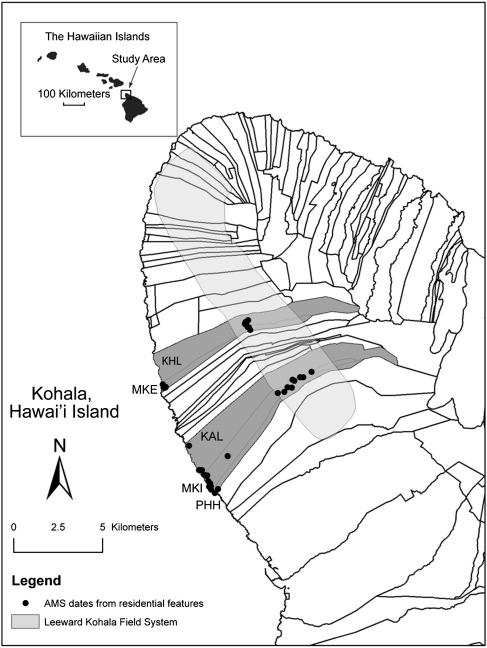
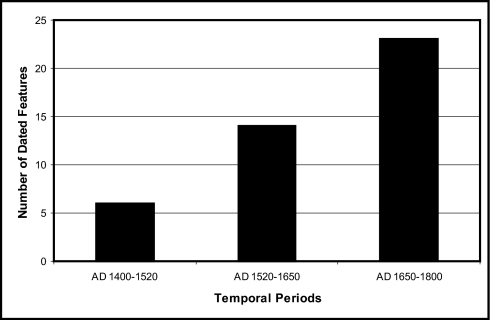
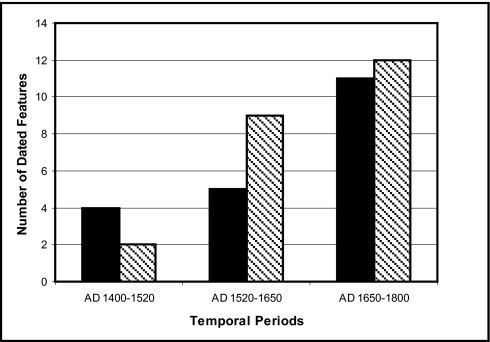
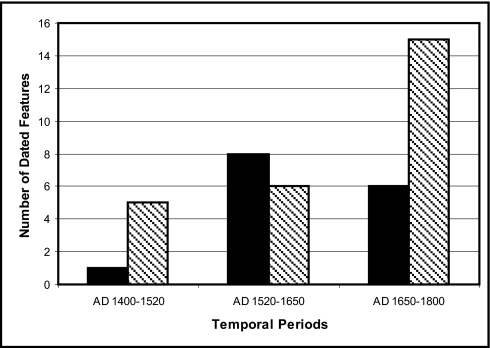
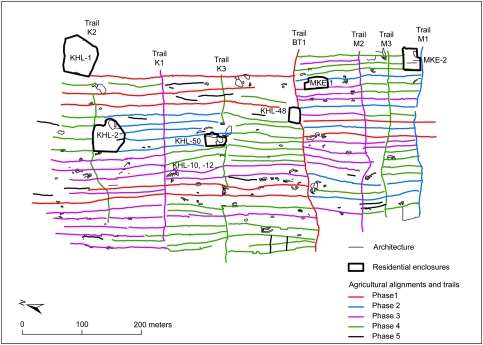
The Leeward Kohala Field System (LKFS) covering ∼ 60 km(2) on Hawai'i Island is one of the world's best-studied archaeological examples of preindustrial agricultural intensification. Archaeological correlates for households over a 400-y period of intensification of the LKFS (A.D. 1400-1800) indicate that household age, number, and distribution closely match the expansion of agricultural features at both macro- and microscales. We excavated and dated residential complexes within portions of five traditional Hawaiian land units (ahupua'a), two in the central core of the field system and three in the southern margins. Forty-eight radiocarbon dates from 43 residential features indicate an overall pattern of exponential increase in the numbers of households over time. Spatial distribution of these dates suggests that the core of the LKFS may have reached a population saturation point earlier than in the southern margins. Bayesian statistical analysis of radiocarbon dates from residential features in the core region, combined with spatial analysis of agricultural and residential construction sequences, demonstrates that the progressive subdivision of territories into smaller socioeconomic units was matched by addition of new residences, probably through a process of household fissioning. These results provide insights into the economic processes underlying the sociopolitical transformation from chiefdom to archaic state in precontact Hawai'i.
Conflict of interest statement
The authors declare no conflict of interest.
Figures
References
-
- Brookfield HC. Intensification and disintensification in Pacific agriculture. Pac Viewp. 1972;13:30–47.
-
- Boserup E. The Conditions of Agricultural Growth: The Economics of Agrarian Change Under Population Pressure. Chicago: Aldine; 1965.
-
- Brookfield H, Hart D. Melanesia: A Geographical Interpretation of an Island World. London: Methuen; 1971.
-
- Turner BL, Doolittle WE. The concept and measure of agricultural intensity. Prof Geogr. 1978;30:297–301.
-
- Leach H. Intensification in the Pacific. Curr Anthropol. 1999;40:311–339.
Publication types
MeSH terms
Substances
LinkOut - more resources
Full Text Sources
