. 2011 May 3;108(18):7414-8.
doi: 10.1073/pnas.1017672108. Epub 2011 Apr 18.

Protein induced fluorescence enhancement as a single molecule assay with short distance sensitivity

Affiliations

Protein induced fluorescence enhancement as a single molecule assay with short distance sensitivity

Helen Hwang et al. Proc Natl Acad Sci U S A. .

Abstract

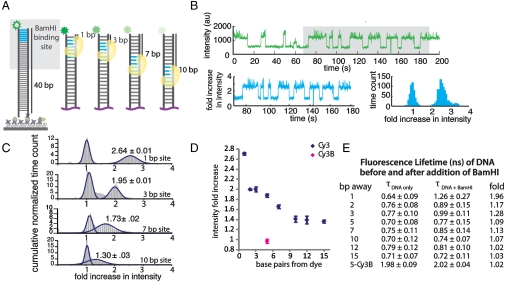
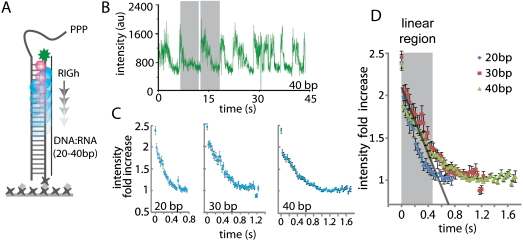
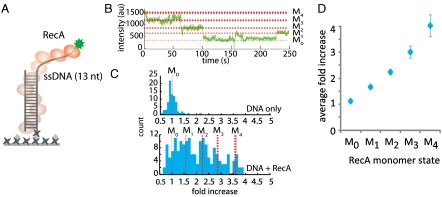
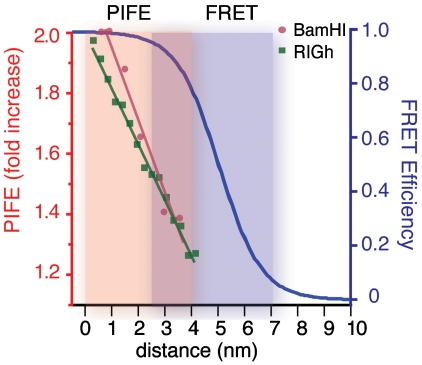
Single-molecule FRET has been widely used for monitoring protein-nucleic acids interactions. Direct visualization of the interactions, however, often requires a site-specific labeling of the protein, which can be circuitous and inefficient. In addition, FRET is insensitive to distance changes in the 0-3-nm range. Here, we report a systematic calibration of a single molecule fluorescence assay termed protein induced fluorescence enhancement. This method circumvents protein labeling and displays a marked distance dependence below the 4-nm distance range. The enhancement of fluorescence is based on the photophysical phenomenon whereby the intensity of a fluorophore increases upon proximal binding of a protein. Our data reveals that the method can resolve as small as a single base pair distance at the extreme vicinity of the fluorophore, where the enhancement is maximized. We demonstrate the general applicability and distance sensitivity using (a) a finely spaced DNA ladder carrying a restriction site for BamHI, (b) RNA translocation by DExH enzyme RIG-I, and (c) filament dynamics of RecA on single-stranded DNA. The high spatio-temporal resolution data and sensitivity to short distances combined with the ability to bypass protein labeling makes this assay an effective alternative or a complement to FRET.


Conflict of interest statement

The authors declare no conflict of interest.

Figures

Fig. 1.
Fig. 1.
BamHI-induced PIFE effect. (A) BamHI recognition sequence (blue) was positioned at a known distance away from the Cy3 fluorophore (green) on a 40-bp double-stranded DNA. (B) A representative single-molecule trace obtained from 1-bp‐away site shows BamHI binding and dissociation as an abrupt increase and decrease in fluorescence signal, respectively (top). The raw intensity is normalized to the DNA only intensity (bottom left) and built into a histogram of fold increase for the single molecule (bottom right). (C) Cumulative histograms of intensity fold increase were built from over 200 molecules for 1-, 3-, 7-, and 10-bp‐away sites. (D) Summary of distance-dependent PIFE. Cy3B (pink) does not show PIFE effect. (E) Fluorescence lifetime of all DNA constructs before and after BamHI addition.
Fig. 2.
Fig. 2.
RIGh-induced PIFE effect. (A) Schematic of RIGh translocation on RNA∶DNA heteroduplex. (B) A single molecule trace of RIGh translocation. (C) Overlay of about 50 single-molecule traces from 20, 30, and 40 duplex. (D) Overlay of averaged translocation events from all three duplexes. The shaded region represents the PIFE-sensitive range at which translocation signals are most linear.
Fig. 3.
Fig. 3.
RecA mediated PIFE effect on ssDNA. (A) Schematic of RecA monomers forming a filament on single-strand DNA. (B) A representative single-molecule trace displaying RecA monomer binding and dissociation. PIFE levels correspond to M0 to M4 states. (C) Intensity histograms from the clustering analysis show a narrow single peak for DNA only (top) and appearance of distinct peaks corresponding to M0 to M4 states when RecA is added (bottom). (D) Plot of the average fold increase obtained from five independent measurements.
Fig. 4.
Fig. 4.
Distance sensitivity of PIFE vs. FRET. The circles (red) and squares (green) represent data obtained from the linear portion of the BamHI and RIGh experiments, respectively. The lines are their respective linear fit. The orange and purple shades indicate PIFE sensitivity (0–4 nm) and FRET sensitivity (2.5–7.5nm), respectively.

References

    1. Joo C, et al. Real-time observation of RecA filament dynamics with single monomer resolution (Translated from eng) Cell. 2006;126:515–527. (in eng) - PubMed
    1. Myong S, Rasnik I, Joo C, Lohman TM, Ha T. Repetitive shuttling of a motor protein on DNA (Translated from eng) Nature. 2005;437:1321–1325. (in eng) - PubMed
    1. Abbondanzieri EA, et al. Dynamic binding orientations direct activity of HIV reverse transcriptase (Translated from eng) Nature. 2008;453:184–189. (in eng) - PMC - PubMed
    1. Woodside MT, et al. Direct measurement of the full, sequence-dependent folding landscape of a nucleic acid (Translated from eng) Science. 2006;314:1001–1004. (in eng) - PMC - PubMed
    1. Ha T. Single-molecule fluorescence methods for the study of nucleic acids (Translated from eng) Curr Opin Struct Biol. 2001;11:287–292. (in eng) - PubMed

Publication types

MeSH terms

LinkOut - more resources