Non-invasive imaging of neuroanatomical structures and neural activation with high-resolution MRI
- PMID: 21503138
- PMCID: PMC3071494
- DOI: 10.3389/fnbeh.2011.00016
Non-invasive imaging of neuroanatomical structures and neural activation with high-resolution MRI
Abstract
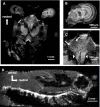
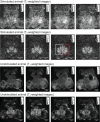
Several years ago, manganese-enhanced magnetic resonance imaging (MEMRI) was introduced as a new powerful tool to image active brain areas and to identify neural connections in living, non-human animals. Primarily restricted to studies in rodents and later adapted for bird species, MEMRI has recently been discovered as a useful technique for neuroimaging of invertebrate animals. Using crayfish as a model system, we highlight the advantages of MEMRI over conventional techniques for imaging of small nervous systems. MEMRI can be applied to image invertebrate nervous systems at relatively high spatial resolution, and permits identification of stimulus-evoked neural activation non-invasively. Since the selection of specific imaging parameters is critical for successful in vivo micro-imaging, we present an overview of different experimental conditions that are best suited for invertebrates. We also compare the effects of hardware and software specifications on image quality, and provide detailed descriptions of the steps necessary to prepare animals for successful imaging sessions. Careful consideration of hardware, software, experiments, and specimen preparation will promote a better understanding of this novel technique and facilitate future MEMRI studies in other laboratories.
Keywords: crayfish; manganese-enhanced magnetic resonance imaging; neural activity; neuroanatomy.
Figures


Similar articles
-
Isotropic 25-Micron 3D Neuroimaging Using ex vivo Microstructural Manganese-Enhanced MRI (MEMRI).Front Neural Circuits. 2018 Dec 6;12:110. doi: 10.3389/fncir.2018.00110. eCollection 2018. Front Neural Circuits. 2018. PMID: 30574072 Free PMC article.
-
Reproducible imaging of rat corticothalamic pathway by longitudinal manganese-enhanced MRI (L-MEMRI).Neuroimage. 2008 Jul 1;41(3):668-74. doi: 10.1016/j.neuroimage.2008.03.018. Epub 2008 Mar 25. Neuroimage. 2008. PMID: 18445533
-
Manganese-enhanced magnetic resonance imaging.Methods Mol Biol. 2011;771:531-68. doi: 10.1007/978-1-61779-219-9_28. Methods Mol Biol. 2011. PMID: 21874497
-
Applications of manganese-enhanced magnetic resonance imaging (MEMRI) to image brain plasticity in song birds.NMR Biomed. 2004 Dec;17(8):602-12. doi: 10.1002/nbm.936. NMR Biomed. 2004. PMID: 15761949 Review.
-
Applications of Manganese-Enhanced Magnetic Resonance Imaging in Ophthalmology and Visual Neuroscience.Front Neural Circuits. 2019 May 14;13:35. doi: 10.3389/fncir.2019.00035. eCollection 2019. Front Neural Circuits. 2019. PMID: 31156399 Free PMC article. Review.
Cited by
-
Reduced Cortical Complexity in Children with Developmental Delay in Saudi Arabia.Cureus. 2023 Nov 5;15(11):e48291. doi: 10.7759/cureus.48291. eCollection 2023 Nov. Cureus. 2023. PMID: 38058330 Free PMC article.
-
Functional magnetic resonance microscopy at single-cell resolution in Aplysia californica.Proc Natl Acad Sci U S A. 2014 Jun 10;111(23):8667-72. doi: 10.1073/pnas.1403739111. Epub 2014 May 28. Proc Natl Acad Sci U S A. 2014. PMID: 24872449 Free PMC article.
-
MEMRI for visualizing brain activity after auditory stimulation in frogs.Behav Neurosci. 2019 Jun;133(3):329-340. doi: 10.1037/bne0000318. Epub 2019 May 2. Behav Neurosci. 2019. PMID: 31045394 Free PMC article.
-
Two-step clustering-based pipeline for big dynamic functional network connectivity data.Front Neurosci. 2022 Jul 25;16:895637. doi: 10.3389/fnins.2022.895637. eCollection 2022. Front Neurosci. 2022. PMID: 35958983 Free PMC article.
References
-
- Abramoff M. D., Magelhaes P. J., Ram S. J. (2004). Image processing with image. J. Biophotonics Int. 11, 36–42
-
- Benveniste H., Blackband S. (2002). MR microscopy and high resolution small animal MRI: applications in neuroscience research. Prog. Neurobiol. 67, 393–420 - PubMed
-
- Brinkley C. K., Kolodny N. H., Kohler S. J., Sandeman D. C., Beltz B. S. (2005). Magnetic resonance imaging at 9.4 T as a tool for studying neural anatomy in non-vertebrates. J. Neurosci. Methods 146, 124–132 - PubMed
LinkOut - more resources
Full Text Sources

