. 2012 Feb;227(2):801-12.
doi: 10.1002/jcp.22793.

Tumorigenic polyploid cells contain elevated ROS and ARE selectively targeted by antioxidant treatment

Affiliations

Tumorigenic polyploid cells contain elevated ROS and ARE selectively targeted by antioxidant treatment

Meejeon Roh et al. J Cell Physiol. 2012 Feb.

Abstract

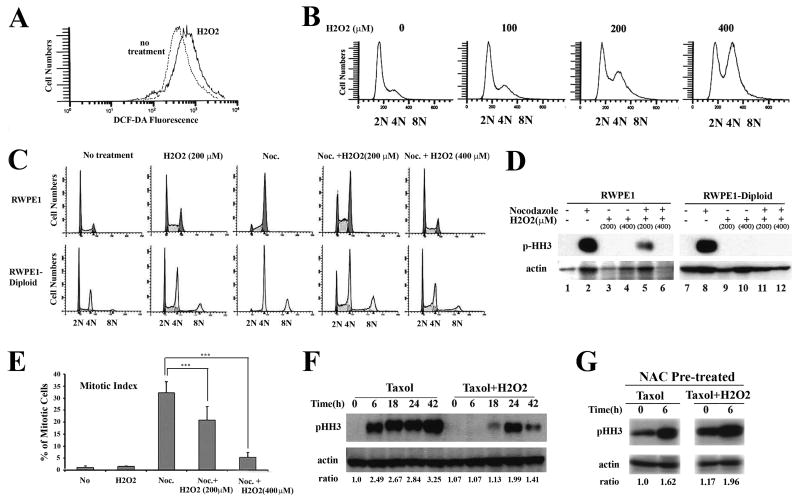
Polyploidy has been linked to tumorigenicity mainly due to the chromosomal aberrations. Elevated reactive oxygen species (ROS) generation, on the other hand, has also been associated with oncogenic transformation in most cancer cells. However, a possible link between ploidy and ROS is largely unexplored. Here we have examined the role of ROS in the tumorigenicity of polyploid cells. We show that polyploid prostate and mammary epithelial cells contain higher levels of ROS due to their higher mitochondrial contents. ROS levels and mitochondrial mass are also higher in dihydrocytochalasin B (DCB)-induced polyploid cells, suggesting that higher levels of ROS observed in polyploid cell can occur due to cytokinesis failure. Interestingly, polyploid cells were more sensitive to the inhibitory effect of the antioxidant, N-Acetyl-L-cysteine (NAC), than control diploid cells. Treatment of polyploid/diploid cells with NAC led to the selective elimination of polyploid cells over time and abrogated the tumorigenicity of polyploid cells. This effect was partially mediated via the Akt signaling pathway. We next explored a possible role for ROS in promoting chromosomal instability by analyzing the effects of ROS on the mitotic stage of the cell cycle. Enhancing ROS levels by treating cells with hydrogen peroxide delayed not only entry into and but also exit from mitosis. Furthermore, increasing ROS levels significantly increased taxol resistance. Our results indicated that increased ROS in polyploid cells can contribute to tumorigenicity and highlight the therapeutic potential of antioxidants by selectively targeting the tumorigenic polyploid cells and by reversing taxol resistance.


Figures

FIGURE 1
FIGURE 1
Polyploid cells display higher ROS level than diploid cells. ROS levels of Pim1-overexpressing diploid and polyploid cells were measured by FACS using dichlorodihydrofluorescein diacetate (DCF-DA) or dihydroethidium (DHE) (bottom) fluorescence dye. A, C: RWPE1 cells. B, D: hTERT-HME cells. In both cell lines, ROS levels were elevated in polyploid cells. Data are represented as means ± SD of three independent experiments and significance of pair-wise comparisons is determined by Student's t test. Representative FACS profiles are also shown. The asterisk (*) indicates a significant increase in polyploid cells compared to diploid cells (**, P < 0.05, ***, P < 0.005).
FIGURE 2
FIGURE 2
Polyploid cells have higher mitochondrial content and mitochondria are the major source of ROS. A & B, relative signals of rhodamine and NAO fluorescence dyes. RWPE1-polyploid (A) or hTERT-HME- polyploid (B) cells as well as their control diploid cells were incubated with 10 μM of either rhodamine 123 or NAO for 30 min before FACS analysis. Rhodamine 123 and NAO measure mitochondrial function and contents respectively. In hTERT-HME cells, Neo empty vector control cells were also used as an additional control. (C). Representative EM image of RWPE1-polyploid cells demonstrating the higher number of mitochondria. Mitochondria were marked as *. Notice multiple mitochondria in the polyploid cell. (D). Relative DCF-DA signals after inhibitor treatment. RWPE1-polyploid cells were treated with rotenone, malonate, antimycin or DPI for 30 min, followed by DCF-DA addition and DCF-DA signals were measured. (E). Representative MitoSOX fluorescent images are shown. RWPE1-diploid and polyploid cells were stained with 5 μM MitoSOX for 10 min followed by counterstaining with 5 μg/ml Hoechst 33342 for 20 min and images were captured using ZEISS 17 microscopy. × 63. (F). Relative fluorescence signals of MitoSOX ™ Red mitochondrial superoxide dye after mitochondria electron transport chain complex inhibitors treatment. RWPE1-polyploid cells were used. (G) Relative DCF-DA signals of DCB treated-cells along with cell cycle profile after DCB treatment. RWPE1 cells were treated with 10 μM DCB for 24 hr and stained with DCF-DA along with Hoechst 33345. Diploid cells in G1 phase (2N) and tetraploid cells in G2/M phase (8N) were used to measure DCF-DA level. (H) Relative signals of DCF-DA, rhodamine 123 and NAO fluorescence dyes after DCB treatment. RWPE-Neo cells were used. (I) MitoSOX ™ Red signal after DCB treatment. Tetraploid cells in G2/M phase (8N) contain higher mitochondrial superoxide than diploid cells in G1 phase (2N). A, B, D, F, G, H, I: Data are represented as means ± SD of two to three independent experiments. **, P < 0.05, ***, P < 0.005.
FIGURE 3
FIGURE 3
The antioxidant NAC abrogates tumorigenicity of polyploid cells and selective removal of polyploid cells by NAC in mixed polyploid/diploid cell cultures. (A). 5 mM NAC treatment for 2 weeks completely blocked colony formation of hTERT-HME-polyploid cells. (B). Colony counting for hTERT-HME-polyploid cells. The number of colonies was decreased in a NAC dose-dependent manner. Data are represented as means ± SD of three independent experiments (five plate each). The asterisk (*) indicates a significant decrease verse untreated group (P< 0.05). (C). Size of colonies was decreased with increasing dose of NAC in RWPE1-polyploid cells. Cells were treated with NAC for 3 weeks. (D). Cell cycle profile of RWPE1-polyploid cells after NAC treatment for 6 weeks. RWPE1-polyploid cells were treated with different doses of NAC for 6 weeks and analyzed for cell cycle profile by FACS. 5 mM NAC treatment preferentially eliminated polyploid cells, thus the minority diploid cells in the culture became a major cell population. (E). Graph showing dose-dependent decrease of polyploid cell population upon NAC treatment. (F). Representative soft agar colony images of NAC-treated polyploid cells as well as untreated polyploid cells. Post-NAC: polyploid cells treated for 6 weeks with 5 mM NAC. Pre-NAC: untreated control polyploid cells. (G). Cell viability of the same cells used for soft agar in E was measured after different dose of NAC treatment. Data are represented as means ± SD of three independent experiments. **, P < 0.05, ns, non significant.
FIGURE 4
FIGURE 4
Polyploid cells are more sensitive to the NAC inhibition of the Akt signaling pathway. (A). Apoptotic rate was measured by active caspase 3. NAC treatment increased apoptosis in both cells; however there is no significant difference between diploid and polyploid cells. (B). DNA synthesis rate was measured by BrDU incorporation in RWPE1-diploid and RWPE1-polyploid cells after NAC treatment. % of BrdU positive cells in untreated cells was similar, however 5 mM NAC treatment decreased % of BrdU positive cells to 29.6 % (2 day), 20.8 % (4 day) (diploid cells), and to 18.8 % (2 day), 10.2 % (4 day) (polyploid cells). A, B: Data are represented as means ± SD of two to three independent experiments. **, P < 0.05, ns, not significant. (C). Reduced Akt activity upon NAC treatment. Polyploid as well as diploid cells were treated with 5 mM NAC in different time point, and Akt activity was measured by phospho-Akt immunoblotting. (D). Akt activity is NAC dose-dependent and polyploid cells are more sensitive to NAC treatment. Different dose of NAC was treated to cells for 24 hr and Akt activity was measured by phospho-Akt immunoblotting. (E). Graph showing quantitation of D. Phospho-Akt level normalized by total Akt level after NAC treatment. Notice dramatically reduced phospho-Akt level in polyploid cells after NAC treatment. (F). Effects of Akt inhibitor on its target molecule. Inhibition of Akt led to the increased level of its target molecule p27kip1. (G). Effects of Akt inhibitor, triciribine, on polyploid cell cycle profile. Polyploid cell fraction was decreased over time upon Akt inhibitor treatment, partially mimicking NAC's effect (see Fig. 3E).
FIGURE 5
FIGURE 5
Increasing ROS using hydrogen peroxide impairs mitotic progression. (A). ROS levels measured by DCF-DA were increased after H2O2 treatment. RWPE1 cells were treated with 200 μM H2O2 for 24 hr and DCF-DA signal intensity was measured. (B). H2O2 treatment induces G2/M cell cycle arrest in a H2O2 dose-dependent manner. RWPE1 cells were used. Data are representative FACS profiles of three independent experiments (C). Nocodazole-induced mitotic cell cycle arrest was abrogated by H2O2 treatment. RWPE1 and RWPE1-diploid cells were treated with 40 nM nocodazole along with H2O2 for 22 hr and cell cycles were analyzed by FACS. Nocodazole treatment induced robust mitotic cell cycle arrest as shown by increased G2/M cell population, however H2O2 treatment abrogated nocodazole-induced mitotic cell cycle arrest as shown by reduced fraction of G2/M cell population. Data are representative FACS profiles of three independent experiments (D). Mitotic checkpoint activation induced by nocodazole is weakened by H2O2. Phospho-histone H3 level was significantly lower or absent in cells treated with nocodazole and H2O2 than in nocodazole only treated-cells (compare lane 2 with lane 5, 6 and lane 8 with 11, 12). (E). Reduced mitotic index after H2O2 and nocodazole treatment. Mitotic index was calculated by counting mitotic cells of DAPI stained cells after H2O2 treatment along with nocodazole. Data are represented as means ± SD of three independent experiments. ***, P < 0.005. (F). Mitotic checkpoint of RWPE1 cells was examined by immunoblotting using phospho-histone H3 after 10 nM taxol treatment along with H2O2 treatment at a different time point. H2O2 treatment not only delayed mitotic checkpoint activation but also failed to sustain it. (G) NAC-pretreated RWPE1 cells can induce phospho-histone H3 after 6 hr taxol treatment even in the presence of H2O2, suggesting that NAC can abrogate effect elicited by H2O2.
FIGURE 6
FIGURE 6
Increasing ROS using hydrogen peroxide delays both mitotic entry and exit. RWPE1 cells were used. A-C: Thymidine-synchronization. H2O2 delayed entry into mitosis and induced G2 cell cycle arrest. (A). Cell cycle analysis of thymidine-synchronized RWPE1 cells released with and without H2O2. (B). Graph showing G2/M cell fraction after release from thymidine-synchronization with and without H2O2. Cells released in the presence of H2O2 show delayed entry into mitosis compared to cells released in the absence of H2O2. (C). H2O2 delayed entry into mitosis and G2 cell cycle arrest as shown by delayed appearance of phospho-histone H3 in cells released in the presence of H2O2. Phospho-histone H3 levels were examined using the samples prepared like FACS analysis. Phospho-histone H3 begin to appear from 8 hr and reached maximum level at 12 hr time point in cells released without H2O2 (lane 4-6), however it did not appear until 12 hr (lane 12) in cells released in the presence of H2O2, indicating delayed entry into mitosis. D-F: Nocodazole synchronization. H2O2 blocked mitotic cell cycle exit. RWPE1 cells were synchronized in mitosis by nocodazole, released in the presence of H2O2, and cyclin B1 level was measured by immunoblotting (D). Cell cycle analysis of nocodazole-synchronized RWPE1 cells released in the absence or presence of H2O2. Notice almost complete block of mitotic cell cycle exit in cells released in the presence of H2O2. (E). Graph showing G2/M cell fraction after release from nocodazole-synchronization in the absence or presence of H2O2. G2/M cell fraction decreased over time in cells released in the absence of H2O2 due to cell cycle progression to G1 phase, however, G2/M cell fraction almost unchanged in cells released in the presence of H2O2, indicating block of mitotic cell cycle exit. (F). Inhibition of cyclin B1 degradation in cells released in the presence of H2O2 after nocodazole synchronization. Cyclin B1 level was reduced in cells released in the absence of H2O2, indicating mitotic exit, however H2O2 treatment inhibited cyclin B1 degradation. B, E: Data are represented as mean ± SD of three independent experiments. The asterisk (*) indicates a significant difference between each group (P< 0.05).
FIGURE 7
FIGURE 7
Enhanced ROS level renders paclitaxel (taxol) resistance. (A). Pim1-overexpressing RWPE1 cells are taxol resistant as shown by significantly lower percentage of sub G1 cell population than control Neo cells after taxol treatment. (B). Combined treatment of RWPE1 cells with H2O2 along with taxol significantly decreased taxol-induced cytotoxicity (increased taxol resistance). Compare taxol only with H2O2 and taxol treatment. (C). H2O2 treatment for one day followed by two day release can maintain ROS level as well as G2/M cell cycle arrest in RWPE1 cells. (D). Separate treatment of H2O2 for one day followed by two day taxol treatment also increased taxol resistance significantly compared to taxol only treatment. (E). RWPE1 cells treated with NAC for one day followed by 2 day taxol treatment significantly decreased taxol resistance compared to taxol only treatment. (F). Model summarizing our data. Polyploidy is believed to induce chromosomal instability (CIN) and this can lead to tumor by inducing further chromosomal instabilities, for example, gain of oncogenes or loss of tumor suppressor genes (TSG). ROS, on the other hand, can also contribute to tumorigenicity by affecting mitotic checkpoint, cell cycle progression and signaling pathway, for example Akt pathway. Increased ROS is demonstrated to cause delay in cell cycle progression, both entry into and exit from mitosis, and this can lead to CIN and tumorigenicity. Interestingly, enhanced ROS also caused taxol resistance. A, B, D, E: Data are represented as mean ± SD of three independent experiments (each 2∼98 different plates or well). **, P < 0.05, ***, P < 0.005.

Similar articles

Cited by

References

    1. Barnouin K, Dubuisson ML, Child ES, Fernandez de Mattos S, Glassford J, Medema RH, Mann DJ, Lam EW. H2O2 induces a transient multi-phase cell cycle arrest in mouse fibroblasts through modulating cyclin D and p21Cip1 expression. J Biol Chem. 2002;277(16):13761–13770. - PubMed
    1. Boveri T. Concerning the origin of malignant tumours by Theodor Boveri. Translated and annotated by Henry Harris. J Cell Sci. 2008;121(1):1–84. - PubMed
    1. Boveris A, Chance B. The mitochondrial generation of hydrogen peroxide. General properties and effect of hyperbaric oxygen. Biochem J. 1973;134(3):707–716. - PMC - PubMed
    1. Caldwell CM, Green RA, Kaplan KB. APC mutations lead to cytokinetic failures in vitro and tetraploid genotypes in Min mice. J Cell Biol. 2007;178(7):1109–1120. - PMC - PubMed
    1. Castillo A, Morse HC, 3rd, Godfrey VL, Naeem R, Justice MJ. Overexpression of Eg5 causes genomic instability and tumor formation in mice. Cancer Res. 2007;67(21):10138–10147. - PubMed

Publication types