Review
. 2010:296:191-226.
doi: 10.1007/128_2010_70.

Cationic liposome-nucleic acid complexes for gene delivery and silencing: pathways and mechanisms for plasmid DNA and siRNA

Affiliations
Review

Cationic liposome-nucleic acid complexes for gene delivery and silencing: pathways and mechanisms for plasmid DNA and siRNA

Kai K Ewert et al. Top Curr Chem. 2010.

Abstract

Motivated by the promises of gene therapy, there is great interest in developing non-viral lipid-based vectors for therapeutic applications due to their low immunogenicity, low toxicity, ease of production, and the potential of transferring large pieces of DNA into cells. In fact, cationic liposome (CL) based vectors are among the prevalent synthetic carriers of nucleic acids (NAs) currently used in gene therapy clinical trials worldwide. These vectors are studied both for gene delivery with CL-DNA complexes and gene silencing with CL-siRNA (short interfering RNA) complexes. However, their transfection efficiencies and silencing efficiencies remain low compared to those of engineered viral vectors. This reflects the currently poor understanding of transfection-related mechanisms at the molecular and self-assembled levels, including a lack of knowledge about interactions between membranes and double stranded NAs and between CL-NA complexes and cellular components. In this review we describe our recent efforts to improve the mechanistic understanding of transfection by CL-NA complexes, which will help to design optimal lipid-based carriers of DNA and siRNA for therapeutic gene delivery and gene silencing.


Figures

Fig. 1
Fig. 1
Mixing DNA and cationic liposomes results in the spontaneous formation of CL–DNA complexes with equilibrium self-assembled structures. The schematics show the local (nanoscale) interior structure of CL–DNA complexes as derived from synchrotron x-ray diffraction data. (A) The lamellar LαC phase of CL–DNA complexes with alternating lipid bilayers and DNA monolayers [22]. (B) The inverted hexagonal HIIC phase of CL–DNA complexes, comprised of DNA inserted within inverse lipid tubules, which are arranged on a hexagonal lattice [23]. (C) The more recently discovered hexagonal HICI phase of CL–DNA complexes, where a cationic lipid with a large dendritic headgroup leads to the formation of rod-like lipid micelles arranged on a hexagonal lattice with DNA inserted within the interstices with honeycomb symmetry [24]. Reprinted in part from [23] and [24] with permission. LaC and HIIC phase images Copyright 1998 American Association for the Advancement of Science. HIC phase image Copyright 2006 American Chemical Society
Fig. 2
Fig. 2
Chemical structures of the zwitterionic neutral lipids DOPC (1,2-dioleoyl-sn-glycero-3-phosphatidylcholine) and DOPE (1,2-dioleoyl-sn-glycero-3-phosphatidylethanolamine) and the cationic lipids DOTAP (1,2-dioleoyl-3-trimethylammonium-propane, a UVL) and MVL5 (a custom-synthesized MVL)
Fig. 3
Fig. 3
(A) Transfection efficiency (TE) as a function of mol % DOPC for DNA complexes prepared with MVL2 (diamonds), MVL3 (squares), MVL5 (triangles), TMVL5 (inverted-triangles), and DOTAP (open circles). All data was taken at ρchg = 2.8. (B) The same TE data plotted against the membrane charge density, σσ shows that TE of the lamellar LαC complexes describes a universal, bell-shaped curve as a function of σM (the solid line is a Gaussian fit to the data). Data for DOTAP/DOPE complexes (open circles, HIIC phase) deviate from the universal curve, indicative of a distinctly different transfection mechanism for the inverted hexagonal phase. Three regimes of transfection efficiency are labeled. Reproduced with permission from [21]. Copyright 2005 John Wiley & Sons Limited
Fig. 4
Fig. 4
Model of cellular uptake of LαC complexes. Complexes adhere to cells due to electrostatics (a) and enter through endocytosis (b and c). Low σM complexes remain trapped in the endo-some (d). High σM complexes escape the endosome (e) where released DNA may form aggregates with cationic biomolecules (f) or the complexes are less able to dissociate and less DNA is available (g). Reproduced with permission from [21]. Copyright 2005 John Wiley & Sons Limited
Fig. 5
Fig. 5
(A) TE of DNA complexes of binary DOTAP/DOPC lipid mixtures (black circles). Their TE increases over several orders of magnitude with increasing molar fraction of monovalent DOTAP (ΦDOTAP). Grey symbols represent TE of DNA complexes of ternary DOTAP/DOPC/Chol lipid mixtures with constant ΦDOTAP = 0.3. Different symbol shapes correspond to different Φchol (cf. legend). (B) The TE of the DNA complexes of ternary DOTAP/DOPC/Chol lipid mixtures (empty circles) plotted against σM significantly deviates from the universal bell shaped curve observed for binary systems [21]. Reprinted with permission from [27]. Copyright 2009 American Chemical Society
Fig. 6
Fig. 6
(A) TEs of DOTAP/DOPC/steroid–DNA complexes. The TE data for ergosterol 2 and ergocalciferol 3 follows a similar dependence on the steroid content in the membrane as that of cholesterol 1: TE rapidly increases with Φsteroid. In contrast, addition of β-estradiol 4, progesterone 5 and dehydroisoandrosterone 6 only modestly enhances TE until high steroid contents (35 mol% and higher) are reached, where phase separation occurs and TE suddenly increases to values comparable with TE of cholesterol-containing complexes. The major structural differences between these two groups of molecules are the absence of the terminal alkyl chain and the presence of a second polar moiety in case of 4–6. (B) Chemical structure of the investigated steroid molecules. (C) TEs of DOTAP/DOPC/steroid–DNA complexes plotted as a function of experimentally obtained σM. The data for cholesterol (dark circles) and ergosterol (dark triangles) deviate significantly from the universal TE curve (black solid line), whereas the TE data for progesterone (grey triangles) and dehydroisoandrosterone (grey circles) nearly follow the universal behavior. Reprinted with permission from [27]. Copyright 2009 American Chemical Society
Fig. 7
Fig. 7
(A) A comparison of the TE of DOTAP/DOPC/Chol–DNA complexes (black squares) and DOTAP/DOPC/PC-cholesterol–DNA complexes (grey bowties). The replacement of DOPC with PC-cholesterol, which has a similarly hydrated headgroup, fails to increase TE. (B) The chemical structures of cholesterol and PC-cholesterol. Reprinted with permission from [27]. Copyright 2009 American Chemical Society
Fig. 8
Fig. 8
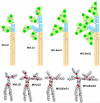
Chemical structures, maximum charge, and molecular models of the DLs MVLG2, MVLG3, MVLBisG1, and MVLBisG2. Branching ornithine spacer groups (highlighted by rectangles) double the number of end groups in each generation. The lipid tails are underlaid with a rounded rectangle, and the cationic end groups (carboxyspermine (4+) or ornithine (2+)) and their charged moieties are also highlighted
Fig. 9
Fig. 9
(A) Schematics of the molecular structure of DL–DNA complexes assembled in slightly disordered HIC; (B) DNA bundles surrounded by a cloud of micelles. The depletion–attraction force caused by micelles and the screening of the electrostatic interaction in the system enables the formation of the DNA bundles. Reprinted with permission from [46]. Copyright 2009 American Chemical Society
Fig. 10
Fig. 10
X-ray diffraction data for (A) MVLG3/DOPC–DNA complexes and (B) MVLBisG1/ DOPC–DNA complexes at ΦDL = 0.2, 0.4, and 1. (C) Ratio of the first and second order diffraction peaks, q2/q1, and (D) ratio of the first and third order diffraction peaks, q3/q1, plotted as a function of ΦDL. (E) The spacing d = 2π/q1 as a function of ΦDL. (F) Plot of dDNA as a function of increasing ΦDL in lamellar complexes. Reprinted with permission from [46]. Copyright 2009 American Chemical Society
Fig. 11
Fig. 11
TE of DL/DOPC–DNA complexes containing MVLG2, MVLBisG1 or MVLBisG2 plotted as a function of σM for two different values of ρchg. (A) TE at ρchg = 4.5 and (B) TE at ρchg = 8. The solid line represents the universal TE curve. [21] The solid symbols mark data for DL/DOPC–DNA complexes in the lamellar phase, while empty symbols correspond to DL/DOPC–DNA complexes in hexagonal phases. Reprinted with permission from [46]. Copyright 2009 American Chemical Society
Fig. 12
Fig. 12
Transfection efficiencies for DOTAP/DOPC and MVLBisG2/DOPC complexes in four different cell lines, plotted against the mole fraction of cationic lipid. The data points were obtained at a constant σchg (7 for HeLa cells, 4.5 for all others), corresponding to a constant amount of DNA applied to the cells for each data point in a plot. Remarkably, MVLBisG2 complexes are significantly more transfectant in mouse embryonic fibroblasts, a cell line empirically know to be hard to transfect and of large practical importance as feeder cells for embryonic stem cells. Reprinted with permission from [24]. Copyright 2006 American Chemical Society
Fig. 13
Fig. 13
(A) Schematic of a lamellar (LαsiRNA) DOTAP/DOPC–siRNA complex. Partial bilayers have been removed, exposing 19 bp siRNAs in the isotropic phase. (B,C) Synchrotron x-ray data of CL–siRNA complexes reveal lamellar (LαsiRNA) patterns for DOTAP/DOPC–siRNA complexes (B) and MVL5 DOPC complexes (C). Note the broad siRNA–siRNA correlation peak in (C), between q002 and q003. Reprinted with permission from [79]. Copyright 2007 American Chemical Society
Fig. 14
Fig. 14
Total (KT, open circles) and non-specific (KNS, open squares) gene knockdown vs. cationic lipid/siRNA molar charge ratio (ρchg) at ΦNL= 0.4 for MVL5/ DOPC–siRNA (Left), DOTAP/DOPC–siRNA (Middle), and DOTAP/DOPE–siRNA (Right) complexes targeting luciferase mRNA in transfected L-cells. Reprinted with permission from [79]. Copyright 2007 American Chemical Society
Fig. 15
Fig. 15
Total gene knockdown (KT) with siRNA complexes targeting the luciferase mRNA in transfected mouse L-cells as a function of mole fraction of neutral lipid ΦNL at ρchg = 15 (A) and ρchg = 2.8 (B). Reprinted with permission from [79]. Copyright 2007 American Chemical Society
Fig. 16
Fig. 16
Cytotoxicity of CL–siRNA complexes (MVL5/DOPC–siRNA, DOTAP/DOPC–siRNA, DOTAP/DOPE–siRNA) targeting the FF luciferase mRNA in mouse L-cells and the corresponding cationic liposomes (without siRNA) as a function of ΦNL (mole fraction of neutral lipid). The filled triangles (ρchg= 10) and filled circles (ρchg= 50) represent toxicity data for cells incubated with complexes. Also plotted are the toxicities measured when cells were incubated with corresponding equivalent amounts of cationic liposomes without siRNA (open triangle (ρchg= 10) and open circle (ρchg= 50)). Cytotoxicity was measured by quantifying the amount of released lactate dehydrogenase from cells with damaged membranes. Reprinted with permission from [79]. Copyright 2007 American Chemical Society
Fig. 17
Fig. 17
(A-D) Cryo-TEM images of diblock (sphere-rod) liposomes comprised of liquid-phase lipid nanorods (white arrows) connected to spherical vesicles. The lipid nanorods are stiff cylindrical micelles with an aspect ratio ≈1000. Their diameter equals the thickness of a lipid bilayer (≈4 nm) and their length reaches up to several micrometers, with a persistence length on the order of millimeters. (C) An inset of B, demonstrating the thickness of the nanorod: white arrow heads point out a thickness of≈4 nm (approximate bilayer thickness, identical for the spherical vesicle and the nanorods). (E) Schematic of a MVLBisG2/DOPC sphere-rod diblock liposome. Reprinted with permission from [58]. Copyright 2008 American Chemical Society
Fig. 18
Fig. 18
(A-E) Cryo-TEM images of triblock (pear-tube-pear) and diblock (pear-tube) liposomes comprised of liquid-phase lipid nanotube segments capped by spherical vesicle. The tubule blocks (arrows) are the first examples of liquid-phase (chain-melted) tubes with diameter on the nanometer scale (between 10 nm and 50 nm). (A) Triblock liposomes (pear-tube-pear). (B) An inset of panel A, disclosing the hollow tubular structure (white arrowheads and white bar point out the bilayer thickness of 4 nm). (C) A diblock liposome. (D) One block liposome encapsulated within another one. (E) A group of block liposomes. (F) Schematics of the MVLBisG2/DOPC tri- and diblock liposomes, manifesting the symmetry breaking between outer and inner mono-layer. Reprinted with permission from [58]. Copyright 2008 American Chemical Society

Similar articles

Cited by

References

    1. Safinya CR, Koltover I. Self Assembled Structures of Lipid–DNA Nonviral Gene Delivery Systems from Synchrotron X-Ray Diffraction. In: Huang L, Hung M-C, Wagner E, editors. Non-Viral Vectors for Gene Therapy. Academic Press; San Diego: 1999.
    1. Ewert KK, Slack NL, Ahmad A, Evans HM, Lin A, Samuel CE, Safinya CR. Cationic Lipid–DNA Complexes for Gene Therapy: Understanding the Relationship between Complex Structures and Gene Delivery Pathways at the Molecular Level. Curr Med Chem. 2004;11:1241–1253. - PubMed
    1. Ewert K, Evans H, Ahmad A, Slack L, Lin A, Martin-Herranz A, Safinya CR. Lipoplex Structures and their Distinct Cellular Pathways. In: Huang L, Hung M-C, Wagner E, editors. Non-Viral Vectors for Gene Therapy. 2nd edn. Elsevier; San Diego: 2005. Part I (Advances in Genetics 53)
    1. Ewert K, Ahmad A, Evans H, Safinya CR. Cationic lipid–DNA complexes for non-viral gene therapy: relating supramolecular structures to cellular pathways. Expert Opin Biol Ther. 2005;5:33–53. - PubMed
    1. Safinya CR, Ewert KK, Ahmad A, Evans HM, Raviv U, Needleman DJ, Lin AJ, Slack NL, George CX, Samuel CE. Cationic Liposome–DNA Complexes: From Liquid Crystal Science to Gene Delivery Applications. Phil Transact Royal Soc A. 2006;364:2573–2596. - PubMed

Publication types