. 2012 Jan 20;21(2):181-90.
doi: 10.1089/scd.2011.0162. Epub 2011 Jun 15.

Widespread transcription in an amphibian oocyte relates to its reprogramming activity on transplanted somatic nuclei

Affiliations

Widespread transcription in an amphibian oocyte relates to its reprogramming activity on transplanted somatic nuclei

Ilenia Simeoni et al. Stem Cells Dev. .

Abstract

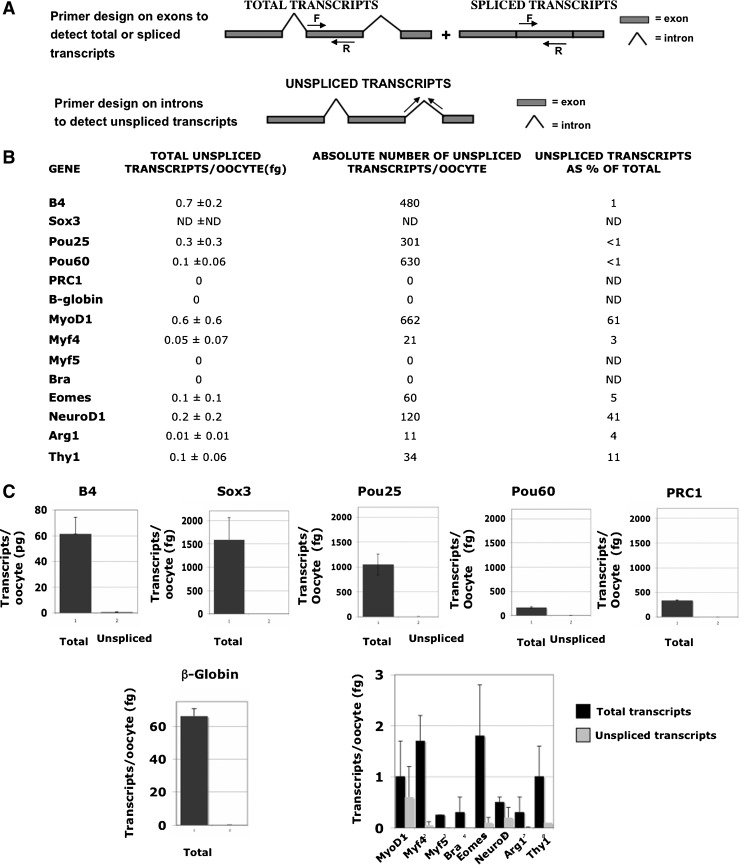
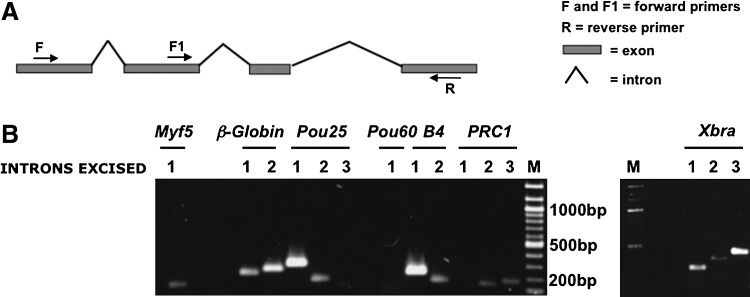
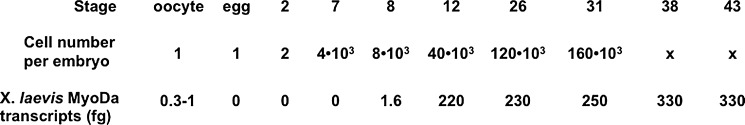
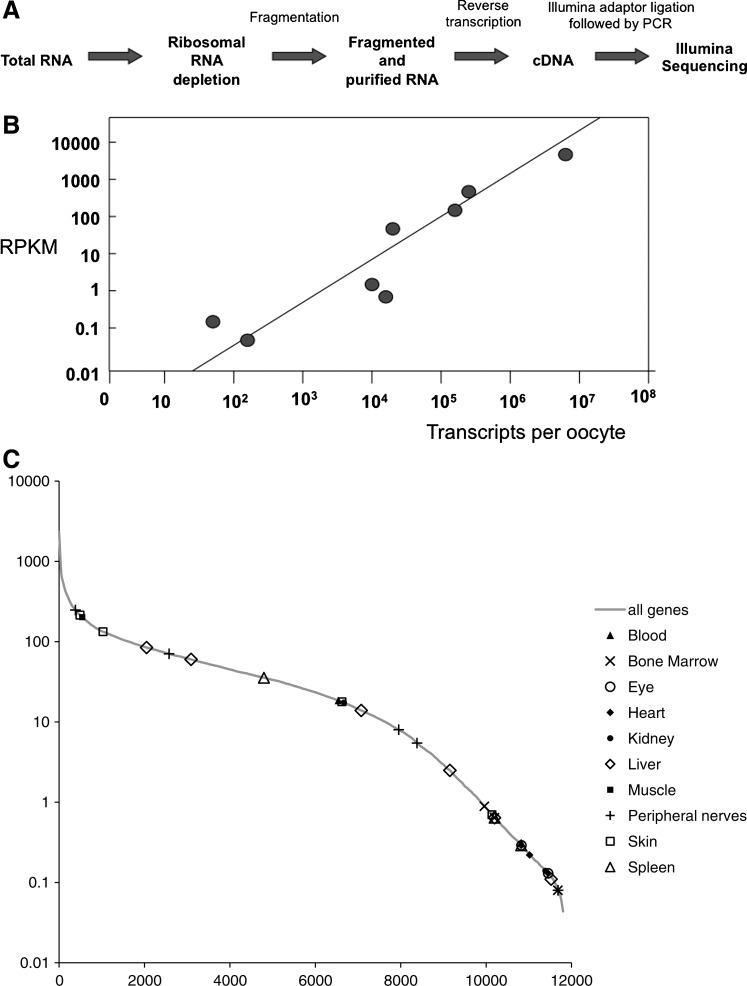
Amphibian oocytes have the special ability to directly induce the transcription of pluripotency and other genes in transplanted somatic nuclei. To this extent, oocytes induce a stem cell-like pattern of transcription in somatic cell nuclei. We ask whether the induced transcription in transplanted nuclei reflects the normal transcriptional activity of oocyte genes. We describe here the transcript content of a wide range of genes in Xenopus tropicalis oocytes. Using accurate quantitation, we find that each mature oocyte has accumulated several hundred transcripts of cell-type specific genes. This value is several orders of magnitude greater than the "leakage" level found in most somatic cells and about the same level found in somatic cells where these genes are fully expressed. Illumina sequencing confirms the high transcript content of a mature Xenopus oocyte. Most of the transcripts from these highly expressed genes in oocytes are correctly and efficiently spliced. Our results contribute a more quantitative view of certain amphibian oocyte transcripts than previously available. Our results also show that transplanted somatic nuclei conform, with respect to the genes analyzed, to the transcriptional characteristics of the recipient oocytes.


Figures

FIG. 1.
FIG. 1.
The follicular cell layers surrounding the Xenopus tropicalis oocytes do not interfere with the quantitation of the specific oocyte transcripts. Liberase treatment efficiently removes follicle cells from oocytes. Oocytes are checked under a stereomicroscope with either normal light (a) or ultraviolet light (b–d) after Hoechst staining to detect the presence of follicular cells. (b) Thousands of follicular cell nuclei surrounding a single oocyte are visible after Hoechst staining. (c) Follicular cells are partially detached as a whole layer during liberase treatment. (d) After liberase treatment, very rarely, a few follicular cells remain attached to the oocyte. These can be seen, and such oocytes were discarded. Arrows (in d) point to 4 follicular cells. In all panels, oocytes are positioned with the brown-pigmented animal cap facing up and to the left and the white vegetal pole facing down to the right. Scale bar: 100 μm. All the tested transcripts (apart from globin) that are abundantly present in the oocyte are absent in the follicle cells (see Table 1).
FIG. 2.
FIG. 2.
Most transcripts are efficiently spliced. (A) Primers (F, forward; R, reverse) were chosen in the same exon to detect both spliced and unspliced transcripts. Primers in the same intron were used to measure unspliced transcripts alone. (B) The amount of the unspliced transcripts (pg or fg) has been converted into absolute numbers of unspliced transcripts per oocyte. Unspliced transcripts have been also represented as a percentage of the total transcripts. (C) The majority of total transcripts are correctly spliced. Black and gray bars represent total and unspliced transcripts, respectively. Results are mean±standard deviation of 3 independent experiments (oocytes isolated and processed from 3 frogs). Note that Sox3 does not include any unspliced transcripts because of the absence of introns. The most abundant transcripts are represented in single charts. The low abundant transcripts are represented together in a chart at the bottom right of the figure.
FIG. 3.
FIG. 3.
Introns are efficiently spliced out in X. tropicalis oocytes. (A) Diagram showing primer position for splicing events that are not adjacent. (B) A selection of primer sets has been designed for adjacent or distant exons to test whether different introns are spliced out with the same efficiency. Myf5 1 represents primers for Myf5 transcripts that spread between exon 1 and exon 2. A similar design has been used for the other genes. β-Globin: 1, exon 1– exon 2; 2, exon 2 – exon 3; Pou25: 1, exon 1 – exon 2; 2, exon 3 – exon 4; 3, exon 4 – exon 5; Pou60: 1, exon 2 – exon 3; B4: 1, exon 1 – exon 2; 2, exon 2 – exon 3; PRC1: 1, exon 9 – exon 19; 2, exon 10 – exon 11; 3, exon 11 – exon 12; Xbra: 1, exon 1 – exon 2; 2, exon 7 – exon 8; 3, exon 6 – exon 8. Weak bands exist near the bottom of the tracks for Pou60.1 and PRC1.1. All DNA bands present on the agarose gel represent spliced transcripts in accord with their small sizes. M, marker track for size recognition.
FIG. 4.
FIG. 4.
Analysis of Xenopus transcripts at different stages of development. MyoDa transcripts were determined by real-time quantitative polymerase chain reaction (qPCR) in Xenopus laevis. MyoDa transcripts are present at the oocyte stage but are absent in an unfertilized egg, stage 2 cell, and stage 7. After the midblastula transition, MyoDa transcripts start to be accumulated as the percentage of muscle cells increases in the embryo. At stages 12–43, it is assumed that the cells that contain MyoD are 5% of the total cell number. Semi-qPCR has been performed to detect maternally or zygotically inherited transcripts. RNA was extracted from samples of 8 embryos. Reverse transcription was carried out by PCR. At stage 26, 5% of total cells (ie, 6,000) are assumed to be muscle, and altogether these contain ∼250 fg MyoD transcripts. This is equivalent to 0.04 fg or 200 transcripts of MyoD per cell.
FIG. 5.
FIG. 5.
Illumina sequencing. (A) Library construction after ribosomal RNA depletion using adaptors for the Illumina platform. (B) A graph showing the degree of colinearity between gene expression levels measured by qRT-PCR and by deep sequencing for our set of genes of interest (see also Table 2). Vertical axis: Normalized reads per kb per million reads (RPKM) calculated from reads mapped to transcript sequences, from 1 lane of Illumina RNA-seq data, estimated by the method of Mortazavi et al. (2008) (see Methods section). Horizontal axis: Transcripts per oocyte estimated by quantitative reverse transcriptase-polymerase chain reaction (qRT-PCR) data and amplicon lengths for each gene. The straight line corresponds to a linear relationship on the log/log scales of the chart (slope=1). (C) Expression level distribution of ∼11,800 genes detected by Illumina RNA-seq of oocyte RNA samples treated with a ribominus reagent. Superimposed are values for 30 genes found to be the likely Xenopus orthologs of “tissue-specific” human genes from the TiGER database. We analyzed the most enriched genes representing 10 different tissues. The horizontal scale shows the number of different genes: serial number of gene in distribution, with highest expression levels on the left. The vertical scale shows normalized RPKM from 1 lane of Illumina RNA-seq data.

Similar articles

Cited by

References

    1. Flemming W. Zell substanz, Kern, und Zelltheilung. F.C.W. Vogel; Leipzig: 1882.
    1. Callan HG. The nature of lampbrush chromosomes. Int Rev Cytol. 1963;15:1–34. - PubMed
    1. Callan HG. Lampbrush chromosomes. Mol Biol Biochem Biophys. 1986;36:1–252. - PubMed
    1. Callan HG. Gall JG. Berg CA. The lampbrush chromosomes of Xenopus laevis: preparation, identification, and distribution of 5S DNA sequences. Chromosoma. 1987;95:236–250. - PubMed
    1. Gall JG. Murphy C. Assembly of lampbrush chromosomes from sperm chromatin. Mol Biol Cell. 1998;9:733–747. - PMC - PubMed

Publication types

LinkOut - more resources