. 2011 Apr 19:12:199.
doi: 10.1186/1471-2164-12-199.

Using RNA-Seq for gene identification, polymorphism detection and transcript profiling in two alfalfa genotypes with divergent cell wall composition in stems

Affiliations

Using RNA-Seq for gene identification, polymorphism detection and transcript profiling in two alfalfa genotypes with divergent cell wall composition in stems

S Samuel Yang et al. BMC Genomics. .

Abstract

Background: Alfalfa, [Medicago sativa (L.) sativa], a widely-grown perennial forage has potential for development as a cellulosic ethanol feedstock. However, the genomics of alfalfa, a non-model species, is still in its infancy. The recent advent of RNA-Seq, a massively parallel sequencing method for transcriptome analysis, provides an opportunity to expand the identification of alfalfa genes and polymorphisms, and conduct in-depth transcript profiling.

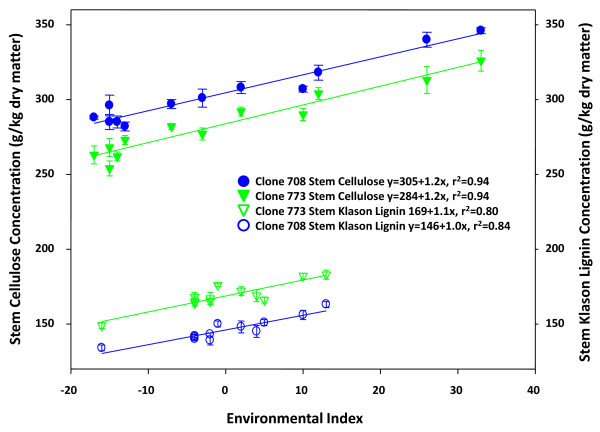
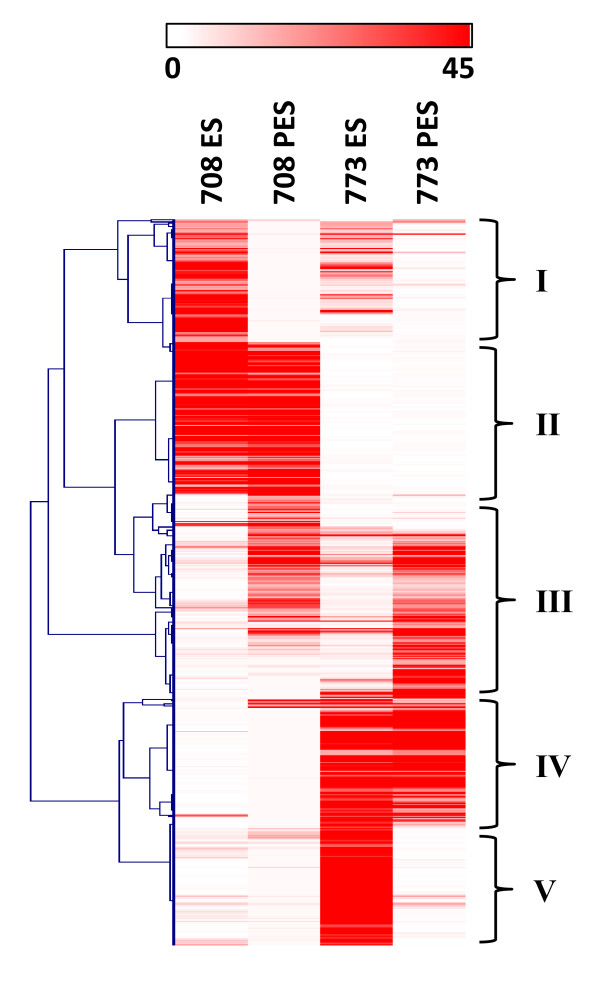
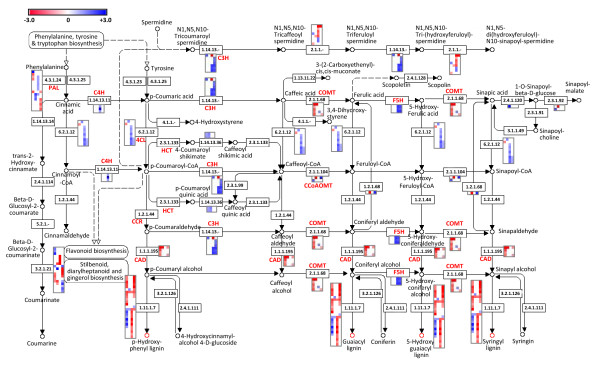
Results: Cell walls in stems of alfalfa genotype 708 have higher cellulose and lower lignin concentrations compared to cell walls in stems of genotype 773. Using the Illumina GA-II platform, a total of 198,861,304 expression sequence tags (ESTs, 76 bp in length) were generated from cDNA libraries derived from elongating stem (ES) and post-elongation stem (PES) internodes of 708 and 773. In addition, 341,984 ESTs were generated from ES and PES internodes of genotype 773 using the GS FLX Titanium platform. The first alfalfa (Medicago sativa) gene index (MSGI 1.0) was assembled using the Sanger ESTs available from GenBank, the GS FLX Titanium EST sequences, and the de novo assembled Illumina sequences. MSGI 1.0 contains 124,025 unique sequences including 22,729 tentative consensus sequences (TCs), 22,315 singletons and 78,981 pseudo-singletons. We identified a total of 1,294 simple sequence repeats (SSR) among the sequences in MSGI 1.0. In addition, a total of 10,826 single nucleotide polymorphisms (SNPs) were predicted between the two genotypes. Out of 55 SNPs randomly selected for experimental validation, 47 (85%) were polymorphic between the two genotypes. We also identified numerous allelic variations within each genotype. Digital gene expression analysis identified numerous candidate genes that may play a role in stem development as well as candidate genes that may contribute to the differences in cell wall composition in stems of the two genotypes.

Conclusions: Our results demonstrate that RNA-Seq can be successfully used for gene identification, polymorphism detection and transcript profiling in alfalfa, a non-model, allogamous, autotetraploid species. The alfalfa gene index assembled in this study, and the SNPs, SSRs and candidate genes identified can be used to improve alfalfa as a forage crop and cellulosic feedstock.


Figures

Figure 1
Figure 1
Regression analyses of cellulose and Klason lignin concentrations in stems of two alfalfa genotypes. The stems of genotype 708 were consistently higher in cellulose and lower in Klason lignin compared to stems of genotype 773 across twelve environmental indexes (field environments). The high r2 values for all regression lines suggest that genotypic differences in stem cellulose and Klason lignin concentrations were environmentally stable.
Figure 2
Figure 2
Comparison of percentage distribution of gene ontology and pathway classifications using four reference databases. The percentage distributions of gene ontology (GO) classes and pathways are shown for the following reference databases: (1) the Medicago sativa Gene Index (MSGI 1.0) assembled in this study, (2) the Medicago truncatula Gene Index (MTGI 9.0), (3) the M. truncatula coding sequences (Mt3.0 cds), and (4) the Arabidopsis coding sequences (At cds).
Figure 3
Figure 3
MapMan overview of cellular metabolism (A) and regulation (B) showing SNP-harboring genes and SNP frequencies. Individual genes are represented by small squares. The SNP frequency for each gene is indicated by the intensity of the blue color on a 0 to 3 scale. Dark blue (scale intensity 3) indicates genes with three or more SNPs. A complete list of SNP-harboring genes, corresponding MapMan functional categories and SNP frequencies are provided in Additional file 5.
Figure 4
Figure 4
Comparison of MSGI 1.0 and Mt3.0 cds as reference sequences for digital gene expression analysis. For a subset of genes involved in stem development independent of genotypic variation, Log2(PES/ES) values from the RNA-Seq data (x-axis) generated using (A) the Medicago sativa Gene Index (MSGI1.0) or (B) the Medicago truncatula coding sequences (Mt3.0 cds) as reference sequences were plotted against Log2(PES/ES) values from the GeneChip data (y-axis) previously generated [25]. For 63 randomly selected genes (C) and 34 selected cell wall genes (D), Log ratio values from the RNA-Seq data (x-axis) generated using MSGI1.0 (O) and Mt3.0 cds (Δ) as reference sequences were plotted against ΔΔCT values obtained from the qRT-PCR data (y-axis).
Figure 5
Figure 5
Hierarchical clustering analysis of the top 200 most differentially expressed genes selected from pair-wise comparisons. Pair-wise comparisons of gene expression were made between stem tissues (ES, PES) in alfalfa genotypes 708 and 773. The RPKM-normalized expression counts for each gene in each library are represented by intensity of the red color on a 0 to 45 scale. Dark red (scale intensity 45) indicates genes with RPKM-normalized expression counts ≥ 45. See Methods for details. Groups I and III, genes differentially expressed in a tissue-specific manner; Groups II and IV, genes differentially expressed in a genotype-specific manner; and Group V, genes differentially expressed in both a genotype- and tissue-specific manner. A complete list of the genes, RPKM-normalized expression counts, and corresponding MapMan functional categories are provided in Additional file 20.
Figure 6
Figure 6
Lignin pathway genes differentially expressed in stem tissues of two alfalfa genotypes. Pair-wise comparisons were made between stem tissues (ES, PES) of genotypes 708 and 773. Columns in each heatmap from left to right: Log2(708ES/773ES), Log2(708PES/773PES), Log2(708PES/708ES), and Log2(773PES/773ES). The rows in each heatmap represent lignin gene sequences identified in MSGI 1.0. The Log2 expression ratio values were false color-coded using a scale of -3 to 3. The intensity of blue and red indicates the degree of up- and down-regulation of the corresponding lignin gene in the denominator in each column mentioned above. The red and blue color saturates at -3 and 3, respectively. See Methods for details. The heatmaps generated were inserted next to the corresponding lignin gene in the lignin biosynthetic pathway diagram downloaded from the KEGG pathway database http://www.genome.jp/kegg/pathway/map/map00940.html. PAL, phenylalanine ammonia-lyase; C4H, cinnamate-4-hydroxylase; 4CL, 4-coumarate-CoA ligase; HCT, hydroxycinnamoyltransferase; C3H, p-coumarate 3-hydroxylase; CCoAOMT, caffeoyl-CoA 3-O-methyltransferase; CCR1, cinnamoyl-CoA reductase 1; F5H, ferulate 5-hydroxylase; COMT, caffeic acid O-methyltransferase; CAD, cinnamyl-alcohol dehydrogenase.

References

    1. Mortazavi A, Williams BA, McCue K, Schaeffer L, Wold B. Mapping and quantifying mammalian transcriptomes by RNA-Seq. Nat Methods. 2008;5(7):621–628. doi: 10.1038/nmeth.1226. - DOI - PubMed
    1. Lister R, Gregory BD, Ecker JR. Next is now:new technologies for sequencing of genomes, trancriptomes, and beyond. Curr Opin Plant Biol. 2009;12:107–118. doi: 10.1016/j.pbi.2008.11.004. - DOI - PMC - PubMed
    1. Marguerat S, Bähler J. RNA-seq: from technology to biology. Cell Mol Life Sci. 2010;67:569–579. doi: 10.1007/s00018-009-0180-6. - DOI - PMC - PubMed
    1. Wilhelm BT, Landry J-R. RNA-Seq-quantitative measurement of expression through massively parallel RNA-Sequencing. Methods. 2009;48:249–257. doi: 10.1016/j.ymeth.2009.03.016. - DOI - PubMed
    1. Wang Z, Gerstein M, Snyder M. RNA-Seq: a revolutionary tool for transcriptomics. Nat Rev Genet. 2009;10:57–63. doi: 10.1038/nrg2484. - DOI - PMC - PubMed

Publication types

MeSH terms