. 2011 Apr 20;100(8):1910-8.
doi: 10.1016/j.bpj.2011.02.042.

Zinc effects on NMDA receptor gating kinetics

Affiliations

Zinc effects on NMDA receptor gating kinetics

Stacy A Amico-Ruvio et al. Biophys J. .

Abstract

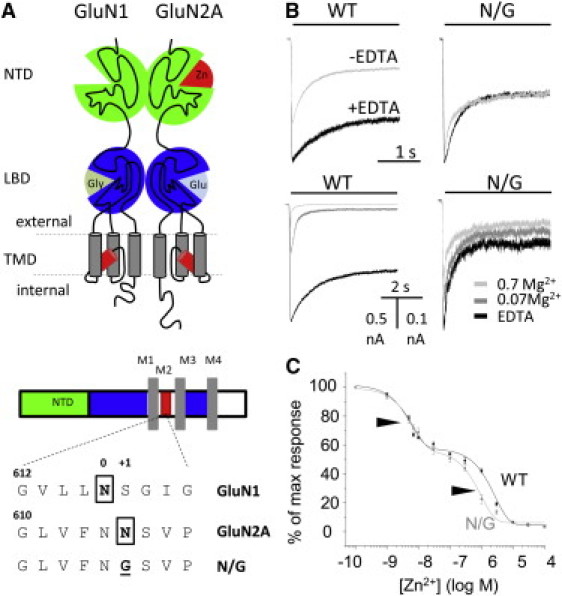
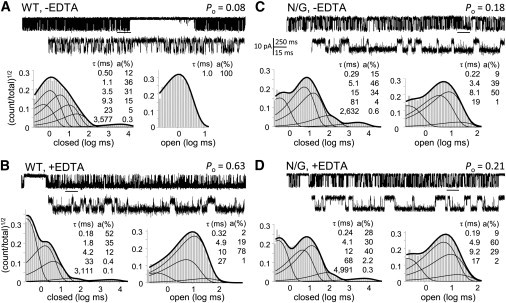
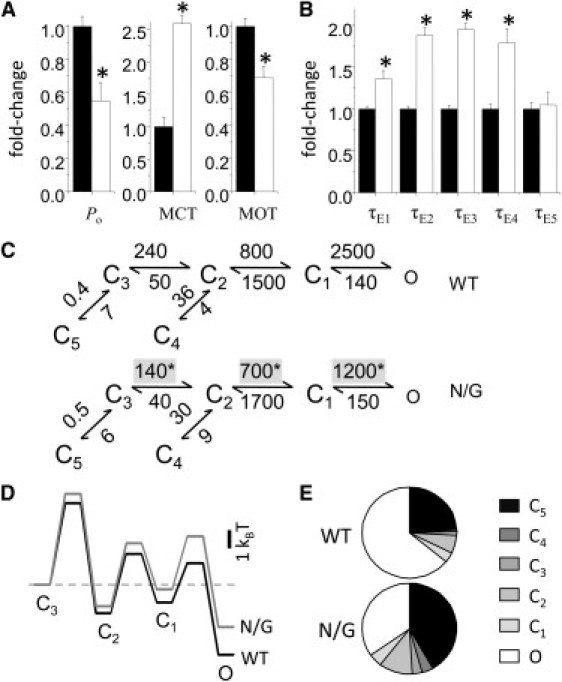
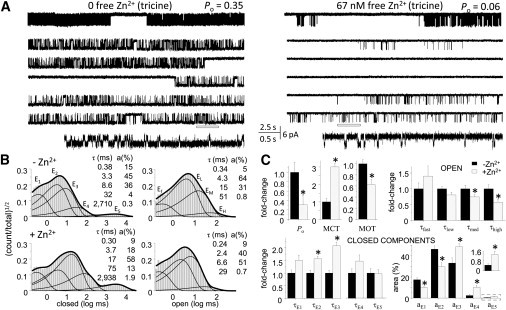
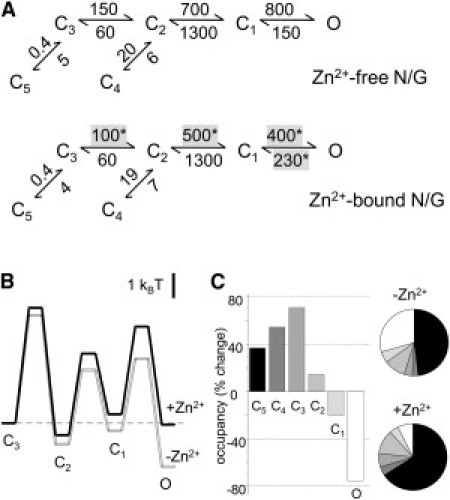
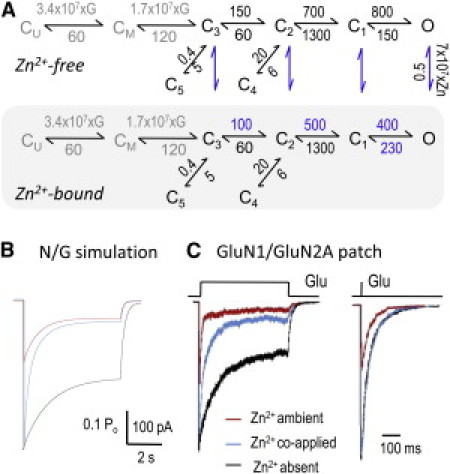
Zinc accumulates in the synaptic vesicles of certain glutamatergic forebrain neurons and modulates neuronal excitability and synaptic plasticity by multiple poorly understood mechanisms. Zinc directly inhibits NMDA-sensitive glutamate-gated channels by two separate mechanisms: high-affinity binding to N-terminal domains of GluN2A subunits reduces channel open probability, and low-affinity voltage-dependent binding to pore-lining residues blocks the channel. Insight into the high-affinity allosteric effect has been hampered by the receptor's complex gating; multiple, sometimes coupled, modulatory mechanisms; and practical difficulties in avoiding transient block by residual Mg(2+). To sidestep these challenges, we examined how nanomolar zinc concentrations changed the gating kinetics of individual block-resistant receptors. We found that block-insensitive channels had lower intrinsic open probabilities but retained high sensitivity to zinc inhibition. Binding of zinc to these receptors resulted in longer closures and shorter openings within bursts of activity but had no effect on interburst intervals. Based on kinetic modeling of these data, we conclude that zinc-bound receptors have higher energy barriers to opening and less stable open states. We tested this model for its ability to predict zinc-dependent changes in macroscopic responses and to infer the impact of nanomolar zinc concentrations on synaptic currents mediated by 2A-type NMDA receptors.


Figures

Figure 1
Figure 1
N/G responses have reduced sensitivity to block by extracellular Mg2+. (A, upper) Diagram of a 1/2A dimer highlights the low-affinity Zn2+-binding site within the TMD and the high-affinity Zn2+-binding site within the NTD (red). (A, lower) Topology of GluN subunits with expanded pore sequence illustrates the asparagine residues (boxed) involved in cation coordination and the pore sequence of the block-resistant construct. (B, upper) Whole-cell currents recorded in the presence and absence of EDTA (10 μM) reveal tonic inhibition of WT but not N/G receptors. (B, lower) Traces recorded in several external concentrations of Mg2+ (mM) illustrate the resistance of N/G receptors to block by external Mg2+. (C) Dose response of N/G (gray; 7.3 nM and 1.0 μM) and WT (black; 5.8 nM and 2.5 μM) receptors show similar sensitivities to nanomolar concentrations of Zn2+.
Figure 2
Figure 2
N/G receptors are resistant to block by contaminant Mg2+ and have altered kinetics. Cell-attached traces (open is down) displayed at two time resolutions. Event histograms below each trace represent interval distributions for one record obtained with (A) WT with no added EDTA (104,352 events), (B) WT with 1 mM EDTA (509,043 events), (C) N/G with no added EDTA (188,412 events), or (D) N/G with 1 mM EDTA (416,360 events) (+100 mV in cell-attached pipette, pH 8).
Figure 3
Figure 3
Reaction mechanism of N/G receptors. (A) Single-channel kinetic parameters for N/G (white; n = 10, 8 × 10⁵ events) relative to WT (black; n = 12, 3.3 × 10⁶ events). (B) Closed-component time constants (τEn) for N/G (white) relative to those for WT (black). (C) Reaction mechanisms estimated from fits of 5C1O models to individual one-channel records obtained from WT (upper) and N/G (lower). Rounded means of rate constants for each condition are in s−1. (D) Relative free-energy profiles calculated from the mechanisms illustrated in C displayed relative to the initial liganded state C3; off-pathway transitions into the long-lived C4 and C5 states are omitted. (E) Predicted fractional occupancies for WT and N/G receptors. Bars and whiskers represent means and standard errors; P < 0.05 in a Student's t-test.
Figure 4
Figure 4
Allosteric effects of extracellular Zn2+ on individual N/G receptors. (A) Cell-attached recordings of N/G currents in the absence (left, 10 mM tricine) and presence of Zn2+ (right, 67 nM free Zn2+). Top traces illustrate a 25-s period that is expanded in the five traces beneath it, with the underlined segment shown at higher resolution at the bottom. (B) Histograms for the records illustrated in A (24 min, 122,562 events; and 27 min, 39,961 events). (Insets) Component time constants (τ) and areas (a). (C) Summary of kinetic parameters estimated for added zinc (gray, N/G with 67 nM free Zn2+, n = 9) relative to control (black, N/G with zero zinc, n = 6). Control open components (in ms): τf, 0.44; τL, 4.3; τM, 12; τH, 41. Control closed components (in ms): τE1, 0.41; τE2, 3.5; τE3, 9.8; τE4, 53; τE5, 3112. Bars and whiskers represent means and standard errors; P < 0.05 in a Student's t-test.
Figure 5
Figure 5
Kinetic mechanism of NMDA receptor inhibition by Zn2+. (A) Reaction mechanisms estimated for N/G receptors with 10 mM tricine (n = 6, 5.7 × 10⁵ events) (upper) or with tricine-buffered zinc (free Zn2+, 67 nM) (n = 9, 7.5 × 10⁵ events) (lower). Rounded mean rate constants for each condition are in s−1; P < 0.05 in a Student's t-test. (B) Free-energy profiles calculated from the kinetic models in A. The desensitized states C4 and C5 are omitted. (C) Changes in state equilibrium occupancies calculated from the models in A (bar graph) and predicted fractional occupancies for Zn2+-free and Zn2+-bound receptors (pie chart).
Figure 6
Figure 6
Zn2+ effects on nonstationary NMDA receptor responses. (A) Tiered model represents glutamate binding and the gating reaction of Zn2+-free receptors (upper), the binding of Zn2+ (vertical arrows, blue), and the gating reaction of Zn2+-bound receptors (lower, gray-shaded). Except for binding reactions, which are in M−1 s−1, all other rate constants are in s−1. [Glu] was set to 1 mM (G) and [Zn2+] to 67 nM (Zn). (B) Simulated responses with the N/G model in A during a 5-s pulse of 1 mM Glu in the absence (black), coapplication (blue), or ambient presence (red) of 67 nM Zn2+. (C) Responses from WT receptors measured in excised patches after fast application of 1 mM Glu for 5 s (left) or 1 ms (right). Conditions are as in B.

References

    1. Takeda A. Zinc homeostasis and functions of zinc in the brain. Biometals. 2001;14:343–351. - PubMed
    1. Sensi S.L., Paoletti P., Sekler I. Zinc in the physiology and pathology of the CNS. Nat. Rev. Neurosci. 2009;10:780–791. - PubMed
    1. Frederickson C.J., Bush A.I. Synaptically released zinc: physiological functions and pathological effects. Biometals. 2001;14:353–366. - PubMed
    1. Smart T.G., Hosie A.M., Miller P.S. Zn2+ ions: modulators of excitatory and inhibitory synaptic activity. Neuroscientist. 2004;10:432–442. - PubMed
    1. Assaf S.Y., Chung S.H. Release of endogenous Zn2+ from brain tissue during activity. Nature. 1984;308:734–736. - PubMed

Publication types

LinkOut - more resources