. 2011 Jun 10;286(23):20923-9.
doi: 10.1074/jbc.M111.230904. Epub 2011 Apr 19.

Phosphorylation of G protein-coupled receptor kinase 1 (GRK1) is regulated by light but independent of phototransduction in rod photoreceptors

Affiliations

Phosphorylation of G protein-coupled receptor kinase 1 (GRK1) is regulated by light but independent of phototransduction in rod photoreceptors

Shoji Osawa et al. J Biol Chem. .

Abstract

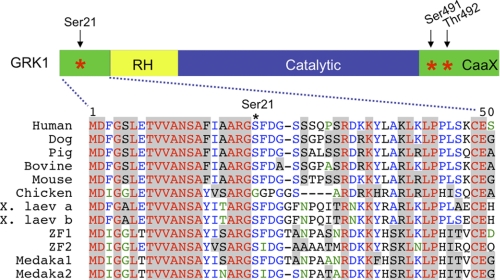
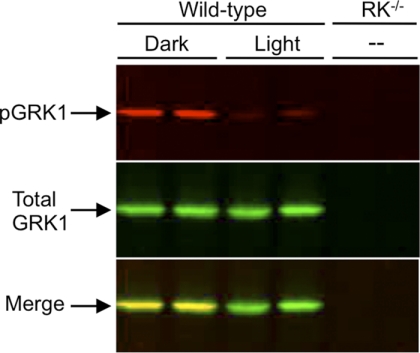
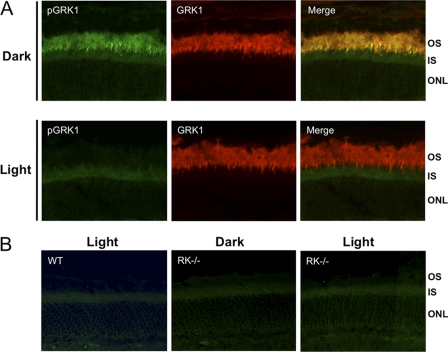
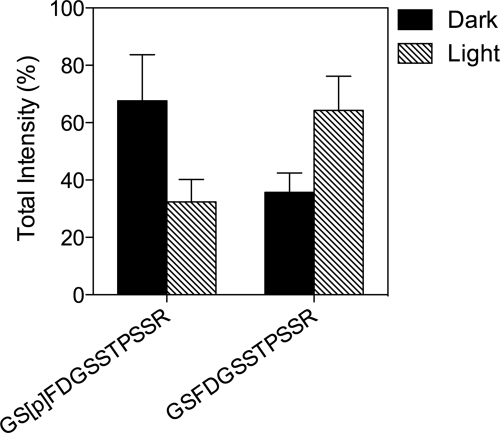
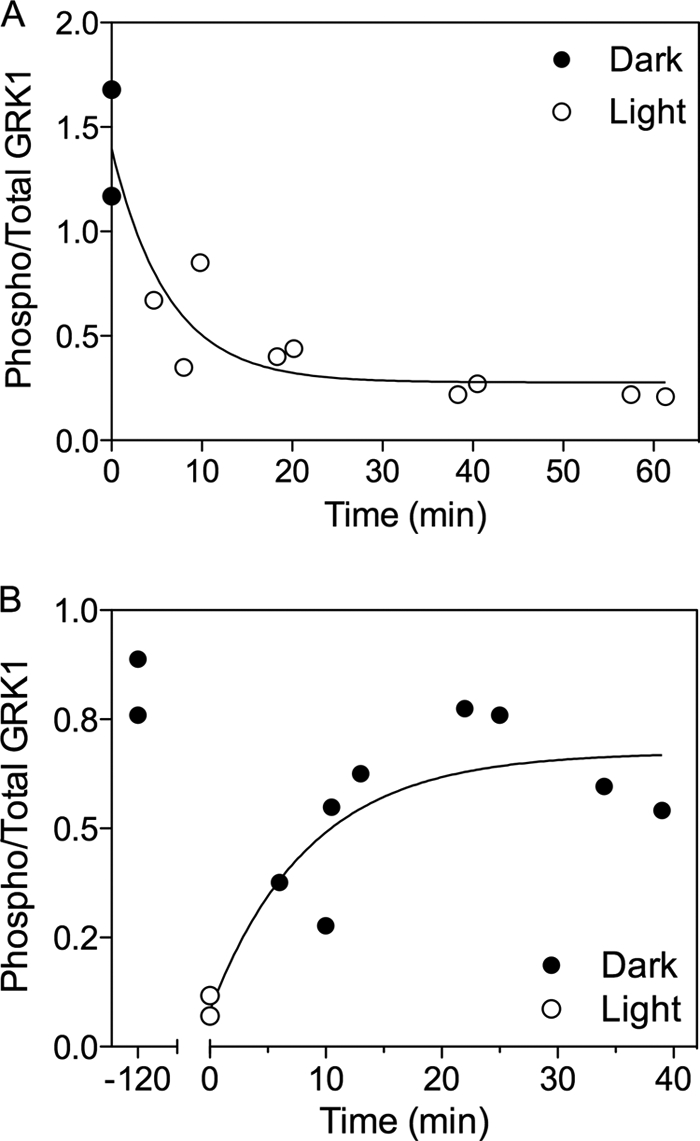
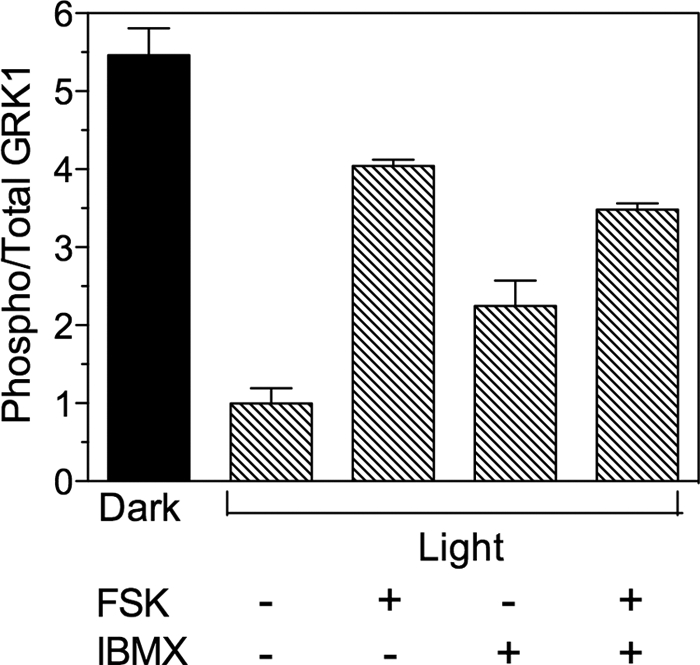
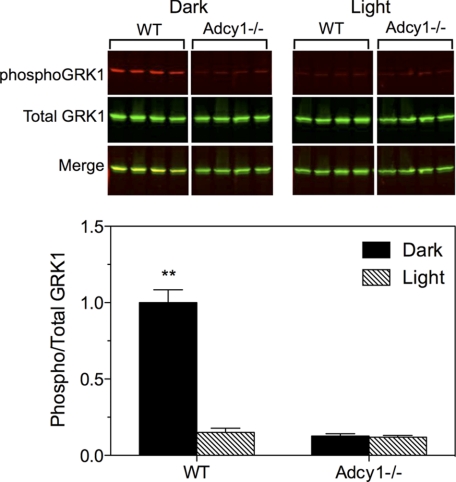
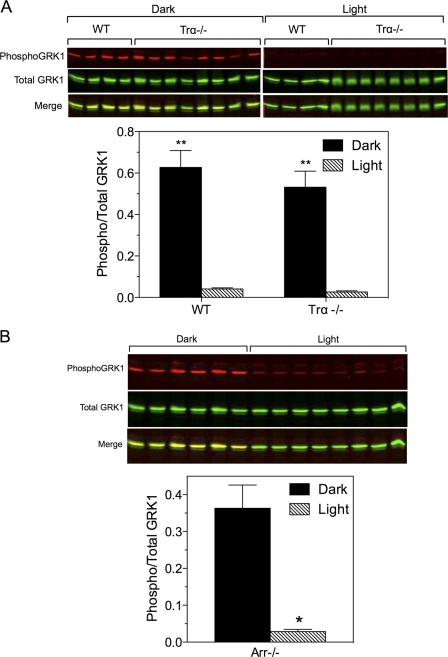
Phosphorylation of rhodopsin by G protein-coupled receptor kinase 1 (GRK1, or rhodopsin kinase) is critical for the deactivation of the phototransduction cascade in vertebrate photoreceptors. Based on our previous studies in vitro, we predicted that Ser(21) in GRK1 would be phosphorylated by cAMP-dependent protein kinase (PKA) in vivo. Here, we report that dark-adapted, wild-type mice demonstrate significantly elevated levels of phosphorylated GRK1 compared with light-adapted animals. Based on comparatively slow half-times for phosphorylation and dephosphorylation, phosphorylation of GRK1 by PKA is likely to be involved in light and dark adaptation. In mice missing the gene for adenylyl cyclase type 1, levels of phosphorylated GRK1 were low in retinas from both dark- and light-adapted animals. These data are consistent with reports that cAMP levels are high in the dark and low in the light and also indicate that cAMP generated by adenylyl cyclase type 1 is required for phosphorylation of GRK1 on Ser(21). Surprisingly, dephosphorylation was induced by light in mice missing the rod transducin α-subunit. This result indicates that phototransduction does not play a direct role in the light-dependent dephosphorylation of GRK1.


Figures

FIGURE 1.
FIGURE 1.
Ser21 is conserved in most vertebrates. The serine phosphorylated by PKA, Ser21, and the autophosphorylation sites, Ser491 and Thr492, are marked with asterisks (*) (12, 53). RH, RGS homology domain; CaaX, isoprenylation motif; X. laev, Xenopus laevis; ZF, zebrafish (Danio rerio); Medaka, medaka fish. The alignment was performed using the software program, VectorNTI (Invitrogen).
FIGURE 2.
FIGURE 2.
Immunoblot analysis of phosphorylated GRK1 in dark- and light-adapted mouse retinas. Mice were dark-adapted overnight and then exposed to 1,500 lux for 1 h or maintained in the dark. After euthanasia, the retinas were removed for immunoblot analysis. The blots were double-labeled with an antibody that recognizes GRK1 phosphorylated on Ser21 (anti-pGRK1; top panel) and an antibody that recognizes total GRK1 (anti-GRK1; middle panel). Retinas from dark-reared mice null for GRK1 (RK−/−) were used as a control. Bottom panel, merged image.
FIGURE 3.
FIGURE 3.
Immunocytochemical analysis of phosphorylated GRK1 in dark- and light-adapted mice. Mice were dark- or light-adapted as described in the legend for Fig. 2, followed by euthanasia and removal of the eyes. Eyecups were fixed as described under “Materials and Methods. ” A, sections from dark- and light-adapted wild-type (WT) mouse retinas were double-labeled with anti-pGRK1 and anti-GRK1. B, retina sections from light-adapted WT mice and dark-reared GRK1 knock-out (RK−/−) mice, which were euthanized and enucleated in the dark or light-adapted prior to euthanasia, were labeled with anti-pGRK1. OS, outer segment; IS; inner segment; ONL; outer nuclear layer.
FIGURE 4.
FIGURE 4.
Mass spectrometry analysis of GRK1 phosphorylated on Ser21 in photoreceptor cells. Retinas from dark- and light-adapted rats were processed for serial, tangential sectioning as described under “Materials and Methods. ” The sections were compared by mass spectrometry for changes in levels of a phosphopeptide corresponding to amino acids 20–31 of rat GRK1 phosphorylated on Ser21 compared with the corresponding unphosphorylated peptide. Error bars represent the range of duplicate dark and light analyses.
FIGURE 5.
FIGURE 5.
Time course of GRK1 phosphorylation and dephosphorylation. A, mice were dark-adapted overnight, then exposed to 1,500 lux for the indicated time periods. B, mice were exposed to 1,500 lux for 2 h and returned to the dark for the indicated time periods. Each point represents the time at which a single retina was solubilized in SDS-containing buffer for immunoblot analysis. Each experiment is representative of at least two independent experiments.
FIGURE 6.
FIGURE 6.
Phosphorylation of GRK1 in retinas ex vivo. One mouse (−light) was dark-adapted overnight and dissected under infrared light. The other mice were exposed to 1,500 lux (+light) for 3–6 h prior to euthanasia. Retinas dissected from light-exposed mice were incubated in the light in the presence (+) or absence (−) of 20 μm forskolin (FSK) and 1 mm 3-isobutyl-1-methylxanthine (IBMX) in HEPES-Ringer buffer for 30 min, followed by homogenization and immunoblot analysis. Error bars represent the range of duplicate samples.
FIGURE 7.
FIGURE 7.
Phosphorylation of GRK1 in retinas from Adcy1−/− mice. Mice were dark-adapted overnight, then exposed to light (1,500 lux) for 2 h or maintained in the dark prior to euthanasia and removal of retinas. Retinas were processed for Western blot analysis to evaluate levels of phosphorylated and total GRK1. Upper panel, representative Western blot; lower panel, average of duplicate experiments. Error bars represent S.E., n = 8. **, p < 0.001 versus all other groups.
FIGURE 8.
FIGURE 8.
Phosphorylation of GRK1 and phosducin in Trα−/− and Arr−/− mice. A, wild-type and Trα−/− mice were dark-adapted overnight, then maintained in the dark or exposed to light for 2–3 h, euthanized, and the retinas were dissected for immunoblot analysis. Upper panel, Western blot of samples collected from two experiments. Lower panel, quantitative analysis of data shown above. Error bars represent S.E., n = 4 for each WT group; n = 8 for each Trα−/− group; **, p < 0.001 dark versus light. B, Arr−/− mice were dark-adapted overnight and exposed to light for 30–40 min. Upper panel, Western blot of samples collected from a single experiment. Lower panel, quantitative analysis of the data shown above. n = 6 (dark) and 8 (light); *, p < 0.0001 versus dark.

References

    1. Wilden U., Hall S. W., Kühn H. (1986) Proc. Natl. Acad. Sci. U.S.A. 83, 1174–1178 - PMC - PubMed
    1. Wilden U., Kühn H. (1982) Biochemistry 21, 3014–3022 - PubMed
    1. Weiss E. R., Ducceschi M. H., Horner T. J., Li A., Craft C. M., Osawa S. (2001) J. Neurosci. 21, 9175–9184 - PMC - PubMed
    1. Chen C. K., Burns M. E., Spencer M., Niemi G. A., Chen J., Hurley J. B., Baylor D. A., Simon M. I. (1999) Proc. Natl. Acad. Sci. U.S.A. 96, 3718–3722 - PMC - PubMed
    1. Lyubarsky A. L., Chen C., Simon M. I., Pugh E. N., Jr. (2000) J. Neurosci. 20, 2209–2217 - PMC - PubMed

Publication types

MeSH terms