. 2011 May;121(5):1894-904.
doi: 10.1172/JCI45529. Epub 2011 Apr 18.

Adult mouse epicardium modulates myocardial injury by secreting paracrine factors

Affiliations

Adult mouse epicardium modulates myocardial injury by secreting paracrine factors

Bin Zhou et al. J Clin Invest. 2011 May.

Abstract

The epicardium makes essential cellular and paracrine contributions to the growth of the fetal myocardium and the formation of the coronary vasculature. However, whether the epicardium has similar roles postnatally in the normal and injured heart remains enigmatic. Here, we have investigated this question using genetic fate-mapping approaches in mice. In uninjured postnatal heart, epicardial cells were quiescent. Myocardial infarction increased epicardial cell proliferation and stimulated formation of epicardium-derived cells (EPDCs), which remained in a thickened layer on the surface of the heart. EPDCs did not adopt cardiomyocyte or coronary EC fates, but rather differentiated into mesenchymal cells expressing fibroblast and smooth muscle cell markers. In vitro and in vivo assays demonstrated that EPDCs secreted paracrine factors that strongly promoted angiogenesis. In a myocardial infarction model, EPDC-conditioned medium reduced infarct size and improved heart function. Our findings indicate that epicardium modulates the cardiac injury response by conditioning the subepicardial environment, potentially offering a new therapeutic strategy for cardiac protection.


Figures

Figure 1
Figure 1. Epicardium is quiescent in the normal postnatal heart.
(A) Expression of WT1 and Wt1-driven fusion protein epitope GFP (Wt1GFPCre/+) in fetal epicardium. White arrowheads, epicardial expression of GFP and WT1; yellow arrows, subepicardial migrating EPDC still expressing WT1 and GFP; white arrows, blood cells inside myocardium. (B) Expression of WT1 or GFP (white arrowheads) in postnatal epicardium. (C) WT1 was also expressed in postnatal human epicardium (red arrowhead). (D) Quantitation of WT1+ or GFP+ epicardial cells in Wt1GFPCre/+ hearts (n = 3–6). (E) Experimental outline for genetic fate mapping in normal postnatal heart using Wt1CreERT2/+;Rosa26mTmG/+ mice. Tam irreversibly changed expression of membrane-localized RFP to membrane-localized GFP (arrowheads). In normal mice, Cre activity was strictly tam dependent. Scale bars: 100 μm; 20 μm (C, right).
Figure 2
Figure 2. Reactivation of the fetal epicardial program after MI.
(A) qRT-PCR of heart RNA for epicardial genes after MI or sham operation, expressed relative to normal heart (no MI). (B) Immunohistochemistry of WT1 in heart 2 weeks after MI or sham operation. Epicardial thickening and WT1 upregulation were observed overlying infarct (regions 1 and 2), peri-infarct (region 3), and remote myocardium (region 4). Arrowheads indicate WT1 expression. (C) Expansion of the Wt1-expressing epicardial region at border zone and remote areas, confirmed by immunostaining for the CreERT2 epitope ESR1 in Wt1CreERT2/+ heart cryosections 2 weeks after MI. Arrowheads, ESR1+ cells in the epicardial region. (D) Quantitation of WT1+ epicardial cells after MI. Epicardium overlying remote (Rm) and infarct (MI) myocardium is shown. n = 3–6. (E) Number of GFP+ cells in adult labeled Wt1CreERT2/+;Rosa26mTmG/+ hearts after MI, as measured by FACS. (F) Proliferation of GFP-labeled EPDC after MI, detected by pH3 staining. (G and H) Epicardial proliferation increased, as assessed by pH3 staining, 3 days to 2 weeks after MI. Shown are (G) representative images and (H) quantification. (I) pH3 staining on canine myocardium. Canine epicardial cells increased proliferation between no MI and 5 days after MI. (J) Representative wedges of dog heart showing epicardium thickness 3 hours and 2 weeks after MI. Black line, outer layer of epicardium; green bar, epicardial thickness; dashed yellow and red lines, border between epicardium and myocardium. Scale bars: 100 μm; 1 mm (B, top left, and J); 10 μm (C, inset; F and G, right). n is shown for each group in A, E, and H. *P < 0.05 versus control.
Figure 3
Figure 3. Fate of EPDCs after MI.
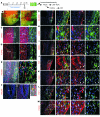
EPDCs marked by GFP lineage tracer (green) were analyzed for coexpression of differentiation markers (red) after MI. Images are representative of 2 weeks after MI; similar results were observed at 1 week, 4 weeks, and 3 months. (A) EPDC labeling protocol. (B) Whole-mount image of Wt1CreERT2/+;Rosa26mTmG/+ heart after MI. GFP was present in the epicardial region (green arrow), whereas myocardium was mainly GFP (red arrow). A region of epicardium was lifted off of the heart to improve visualization. (C and D) EPDCs did not express cardiomyocyte markers TNNT2 or ACTN2. (E and F) EPDCs (arrowheads, E) did not express endothelial marker PECAM in the epicardial region, but were frequently adjacent to ECs (arrows, E). Within the myocardium, very rare GFP+ cells were observed; these cells expressed PECAM (arrow, F). (GI) A subset of EPDCs expressed smooth muscle markers SM-MHC (G), α-SMA (H), and SM22α (I). (JM) A subset of EPDCs expressed mesenchymal/fibroblast markers FN1 (J), ColIII (K), FSP1 (L), and ProCol (M). Scale bars: 100 μm; 1 mm (B); 10 μm (F, right). Myo, myocardium; Endo, endocardium; Epi, epithelium.
Figure 4
Figure 4. Paracrine effect of adult EPDCs.
(A) Morphology of P5 EPDCs. (B) EPDC-CM (1:10 dilution) increased EC number compared with control medium. Cell number was determined by direct counting. n = 4. (C and D) EPDC-CM stimulated EC growth, measured by MTT assay. cbECs were cultured with CM at the indicated dilution and duration. (E) Quantification of ECs stained with cleaved caspase 3 (Casp3) or TUNEL. n = 3. (F) BrdU assay of cbECs cultured with EPDC-CM or control medium. n = 4. (G) EPDCs coculture with cbECs on Matrigel-stimulated tubule formation. EPDCs (green arrowheads) incorporated the vessel-like tubular network formed by cbECs (red arrowheads). (H) EPDC-stimulated angiogenesis in vivo in Matrigel plug assay. Matrigel and cbECs were injected into nude mice alone or in combination with EPDCs or human MSCs (hMSC; positive control). (I and J) Density of blood-filled and PECAM+ vessels in plugs. n = 7–8. (KM) Immunostaining of Matrigel plug sections showed that EPDCs (GFP+, white arrowheads) were located adjacent to human ECs (UEA+) (M) and expressed smooth muscle (CNN) and pericyte (NG2) markers (L and M). (N) Tail vein injection of UEA-labeled ECs within the Matrigel plug (yellow arrows) demonstrated functional connection of cbEC-derived plug vessels with systemic vessels. Scale bars: 200 μm; 10 μm (F, bottom, and M, right). n is shown for each group in I and J. *P < 0.05 versus respective control.
Figure 5
Figure 5. EPDC secretion of proangiogenic factors.
(A) Enriched expression of angiogenic factors in EPDCs 1 week after MI. Expression was measured by qRT-PCR. n = 3–6. (B) Representative result of angiogenesis antibody array probed with EPDC-CM. Boxes indicate several key angiogenesis factors secreted by EPDCs. (C) Neutralizing antibodies showed that VEGFA and FGF2 contribute to the growth-promoting properties of CM. Control indicates no antibody addition. Growth was measured by MTT assay. FGF2 and VEGFA blockade reduced the growth-stimulating activity of CM by about 50%, but combined blockade (Comb) did not further inhibit CM activity. (D) Hypoxia-stimulated EPDC secretion of VEGFA. VEGFA in media was measured by ELISA and antibody array (not shown). Results are representative of 2 repeats. *P < 0.05.
Figure 6
Figure 6. EPDC-CM reduced infarct size and improved heart function.
(A) EPDC-CM reduced infarct size at 1 week. 1-mm short axis slices of heart were stained with TTC, and the infarct size (white color) was measured. n = 6. (B) Vessel density in peri-infarct area 1 week after MI. Representative images of PECAM and BS-1 lectin stained sections are shown. BS-1 quantitation showed increased vessel density in the CM-treated group. n = 10. (C) Cine-MR images obtained 5–6 days after MI. Red line indicates the chamber area. Ejection fraction, calculated from 5 stacked slices, was significantly higher with CM versus control treatment. n = 8. (DG) LV systolic and diastolic function improved with CM treatment. Peak systolic pressure (PSP; D and F), developed systolic pressure (Dev-P; E), and Emax (F, inset), measures of systolic function, were higher with CM at baseline and with dobutamine stress. LV stiffness (G, inset), reciprocally related to diastolic function, was improved with CM. EDP, end-diastolic pressure. n = 9 (control); 6 (EPDC-CM). Scale bars: 2 mm (A); 100 μm (B); 2.5 mm (C). In A and C, lines within boxes denote median, boxes denote interquartile range, and whiskers denote range. *P < 0.05.

References

    1. Hsieh PC, et al. Evidence from a genetic fate-mapping study that stem cells refresh adult mammalian cardiomyocytes after injury. Nat Med. 2007;13(8):970–974. - PMC - PubMed
    1. Lepilina A, et al. A dynamic epicardial injury response supports progenitor cell activity during zebrafish heart regeneration. Cell. 2006;127(3):607–619. doi: 10.1016/j.cell.2006.08.052. - DOI - PubMed
    1. Cai CL, et al. A myocardial lineage derives from Tbx18 epicardial cells. Nature. 2008;454(7200):104–108. doi: 10.1038/nature06969. - DOI - PMC - PubMed
    1. Zhou B, et al. Epicardial progenitors contribute to the cardiomyocyte lineage in the developing heart. Nature. 2008;454(7200):109–113. doi: 10.1038/nature07060. - DOI - PMC - PubMed
    1. Wilm B, Ipenberg A, Hastie ND, Burch JB, Bader DM. The serosal mesothelium is a major source of smooth muscle cells of the gut vasculature. Development. 2005;132(23):5317–5328. doi: 10.1242/dev.02141. - DOI - PubMed

Publication types

Substances