. 2011 May;121(5):1846-57.
doi: 10.1172/JCI43992. Epub 2011 Apr 18.

Identification of a low-molecular weight TrkB antagonist with anxiolytic and antidepressant activity in mice

Affiliations

Identification of a low-molecular weight TrkB antagonist with anxiolytic and antidepressant activity in mice

Maxime Cazorla et al. J Clin Invest. 2011 May.

Abstract

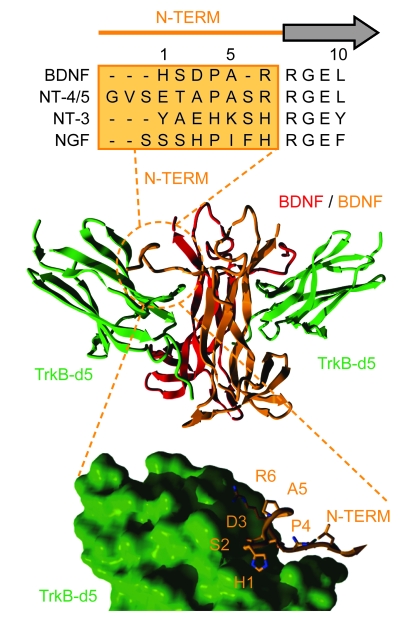
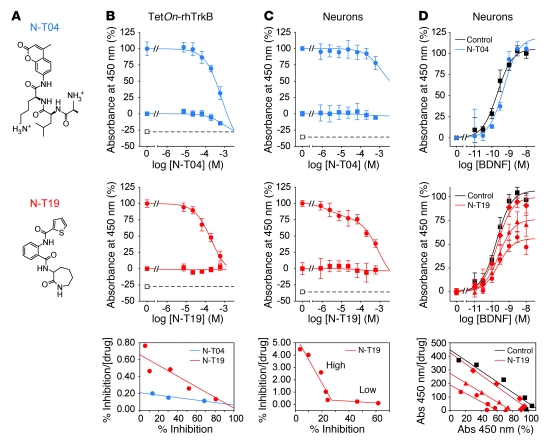
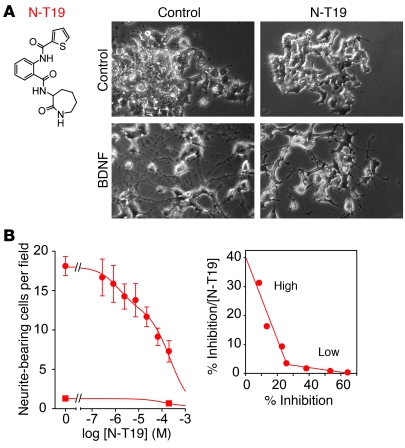
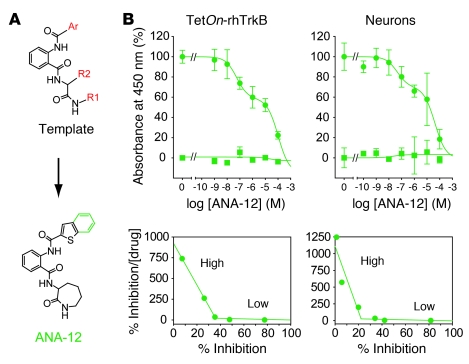
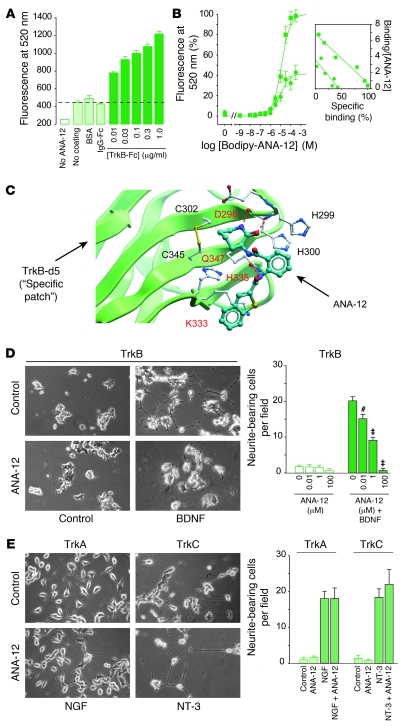
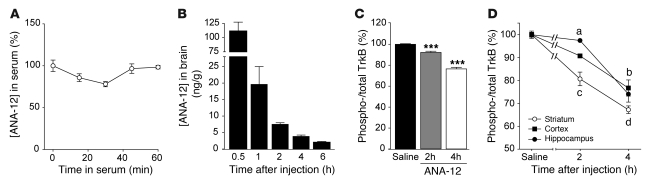
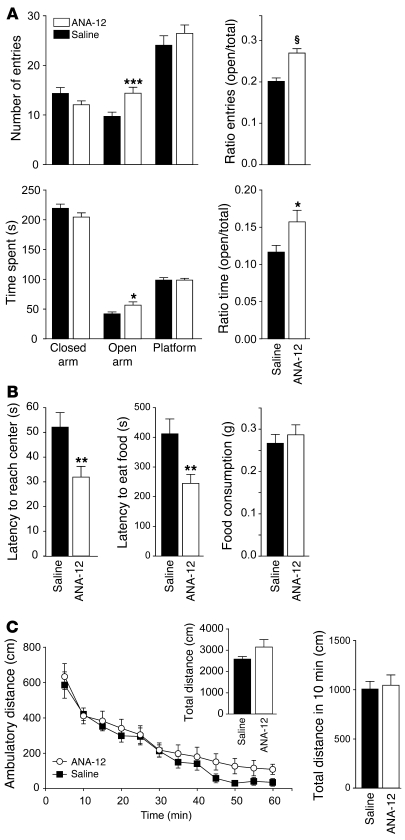
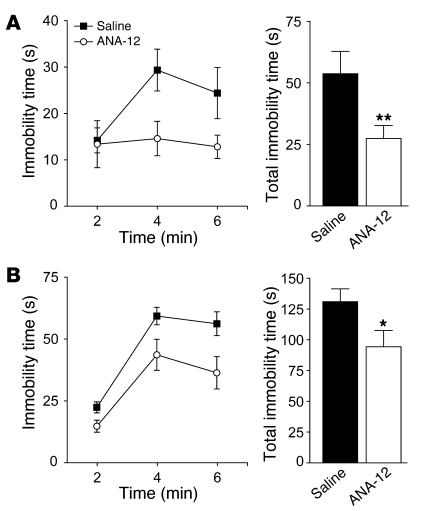
The neurotrophin brain-derived neurotrophic factor (BDNF) and its receptor tropomyosin-related kinase B (TrkB) have emerged as key mediators in the pathophysiology of several mood disorders, including anxiety and depression. However, therapeutic compounds that interact with TrkB receptors have been difficult to develop. Using a combination of structure-based in silico screening and high-capacity functional assays in recombinant and neuronal cells, we identified a low-molecular weight TrkB ligand (ANA-12) that prevented activation of the receptor by BDNF with a high potency. ANA-12 showed direct and selective binding to TrkB and inhibited processes downstream of TrkB without altering TrkA and TrkC functions. KIRA-ELISA analysis demonstrated that systemic administration of ANA-12 to adult mice decreased TrkB activity in the brain without affecting neuronal survival. Mice administered ANA-12 demonstrated reduced anxiety- and depression-related behaviors on a variety of tests predictive of anxiolytic and antidepressant properties in humans. This study demonstrates that structure-based virtual screening strategy can be an efficient method for discovering potent TrkB-selective ligands that are active in vivo. We further propose that ANA-12 may be a valuable tool for studying BDNF/TrkB signaling and may constitute a lead compound for developing the next generation of therapeutic agents for the treatment of mood disorders.


Figures

Figure 1
Figure 1. Computational modeling of the specificity patch.
The structure-based virtual screening was performed by targeting the specificity interaction patch between the N-terminal segment of BDNF (N-TERM, red/orange) and the d5 subdomain of TrkB (TrkB-d5, green). An alignment of the N-terminal amino acid sequence of rodent BDNF, NT-4/5, NT-3, and NGF is shown in the upper panel (the specific region is boxed; dashes represent gaps). The 3D model of the complex between the TrkB-d5 domain (green solid surface) and the BDNF N-terminal part (H1SDPAR6, orange sticks) is illustrated in the lower panel.
Figure 2
Figure 2. Pharmacological properties of N-T04 and N-T19 in different systems.
(A) Structures of the 2 most active compounds, N-T04 and N-T19. (B and C) KIRA-ELISA assessment of N-T04 and N-T19 in absence (filled squares) or presence (filled circles) of BDNF in TetOn-rhTrkB and neuronal cells. Values were normalized to signal obtained with 1 nM (B) or 0.4 nM (C) of BDNF after subtraction of signal obtained in control wells. Compounds were compared with 10 μM of K252a (open squares), a concentration that abolishes basal TrkB activity (20). IC50 values of both high-affinity (4.7 ± 1.9 μM) and low-affinity (231 ± 53 μM) sites for N-T19 in neurons were determined using Eadie-Hofstee plotting of the data (lower panels). Nonlinear regression curve fit for N-T19 in neurons was obtained using a 2-site competition model. Data represent mean ± SEM of 3–6 experiments performed in triplicate. (D) BDNF concentration-response curve in absence (squares) or in presence (diamonds, 3 μM; triangles, 30 μM; circles, 300 μM) of N-T04 or N-T19. A noncompetitive antagonism is clearly demonstrated for N-T19 by Eadie-Hofstee plotting of the data (lower panel). Values were normalized to the maximal BDNF response after subtraction of signal obtained in controls. Data represent mean ± SEM of 4 experiments performed in triplicate.
Figure 3
Figure 3. N-T19 inhibits BDNF-induced neurite outgrowth.
(A) Representative photomicrographs of nnr5 PC12–TrkB cells treated with N-T19 (10 μM) and BDNF, alone or in combination as indicated. Original magnification, ×20. (B) Quantitative analysis of control (squares) and BDNF-induced (circles) neurite outgrowth in presence of increasing concentrations of N-T19. Nonlinear regression curve fit for was performed using a 2-site competition model. IC50 values of both high-affinity (1.5 ± 0.2 μM) and low-affinity (79 ± 12 μM) sites were obtained by Eadie-Hofstee plotting of the data (inset, right panel). Data represent mean ± SEM of 3 experiments performed six times each.
Figure 4
Figure 4. Pharmacological properties of the N-T19 analog ANA-12.
(A) Substructure query used to retrieve close analogs of N-T19 (Ar, any aromatic moiety; R1 and R2, any moiety) and structure of ANA-12. The benzene moiety that differs from the template core is shown in green. (B) KIRA-ELISA assessment of ANA-12 in absence (filled squares) or in presence (filled circles) of BDNF in TetOn-rhTrkB cells and neurons, as described in Figure 2. IC50 values of the high-affinity (TetOn-rhTrkB, 45.6 ± 8.4 nM; neurons, 45.6 ± 6.7 nM) and low-affinity (TetOn-rhTrkB, 87.0 ± 14.0 μM; neurons, 41.1 ± 21.7 μM) sites were determined using Eadie-Hofstee plotting of the data (lower panels). Data represent mean ± SEM of 2–4 experiments performed in triplicates.
Figure 5
Figure 5. ANA-12 directly binds and selectively modulates TrkB.
(A) Bodipy–ANA-12 (100 μM) was incubated with increasing amounts of TrkBECD-Fc, IgG-Fc, BSA, or nothing (negative control; dashed line). Specific binding could be detected only with TrkBECD-Fc. Data represent mean ± SEM of 2 experiments performed in triplicate. (B) Increasing concentrations of bodipy–ANA-12 were incubated with TrkBECD-Fc (1 μg/ml) in the presence (filled circles) or absence (filled squares) of 10 nM BDNF. Values are normalized to maximal signal after subtraction of nonspecific binding (BSA or IgG-Fc). Affinity constants (Kd) were derived from Scatchard plotting of the data (inset, right panel). Data represent mean ± SEM of 4 experiments performed in triplicate. (C) Computational model of the docking of ANA-12 (cyan) into the specificity patch of TrkB-d5 (green ribbon). 3 putative hydrogen bonds (red dotted lines) anchor ANA-12 to TrkB. Note that ANA-12 is surrounded by TrkB-specific amino acid residues (red) in the binding pocket. (D and E) Representative photomicrographs and quantitative analyses of neurotrophin-induced neurite outgrowth in the presence of ANA-12 in nnr5 PC12–TrkB (D), –TrkA, and –TrkC (E) cells. Original magnification, ×20. Data presented for TrkA and TrkC are those obtained with 100 μM of ANA-12 and are not different from their respective controls. #P < 0.01 and P < 0.0001. Data represent mean ± SEM of 3 experiments performed in triplicate.
Figure 6
Figure 6. Injection of ANA-12 i.p. inhibits TrkB receptors in the brain.
(A) ANA-12 stability in mouse serum. ANA-12 was incubated in serum of mice for 15, 30, 45, and 60 minutes at 37°C. Data represent mean ± SEM of 2 experiments. (B) ANA-12 bioavailability in mouse brain, 30 minutes, 1, 2, 4, and 6 hours after a single i.p. injection. Data represent mean ± SEM of 3 animals/group. (C) Pharmacokinetics of TrkB inhibition in the brain following i.p. injection of saline or ANA-12 (0.5 mg/kg) into adult mice. The level of phospho- and total TrkB in the whole brain of saline-treated and ANA-12–treated mice was detected using KIRA-ELISA assays 2 and 4 hours after injection. Values are expressed as a percentage of the signal obtained for saline-treated animals for the 2 time points (data presented for the saline-treated group are those obtained at 2 hours but were similar at 4 hours). Data represent mean ± SEM of 8 animals/group assessed in 2 different assays. ***P < 0.0001 compared with saline. (D) Pharmacokinetics of TrkB inhibition in different brain regions. Data represent mean ± SEM of 8 animals/group assessed in 2 different assays. Two-way ANOVA analyses of the data indicated a significant effect of treatment over time (P < 0.0001) and between structures (P < 0.0001). Post-hoc analysis showed significant effect in (a) striatum (P < 0.001) and cortex (P < 0.01) at 2 hours and in (b) all structures (P < 0.001) at 4 hours, compared with saline. At 2 hours (c), significant differences existed for striatum compared with cortex (P < 0.01) and hippocampus (P < 0.001), while at 4 hours (d), differences were significant between striatum and cortex (P < 0.01) and hippocampus (P < 0.05). For better clarity, the graph is magnified.
Figure 7
Figure 7. ANA-12 demonstrates anxiolytic-like properties.
(A) Exploratory behavior in the elevated plus maze. The number of entries and the time spent in the different arms of the maze are presented. The increased ratio of entries and time in the open arms versus total observed for ANA-12–treated animals is representative of decreased anxiety. (B) Behavioral measures of saline-treated and ANA-12–treated mice in the novelty-suppressed feeding test. The latency to reach the illuminated center and to eat the food was dramatically decreased in animals that received ANA-12, while the home cage food consumption was not different between both groups. (C) Exploratory behavior in the novel open field of saline-treated and ANA-12–treated mice. Ambulatory distance was measured during 60 minutes and was not different between the 2 groups. Inset shows the total ambulatory distance acquired during the 60-minute session. The total distance covered during the first 10 minutes of the task is also shown. *P < 0.05; **P < 0.01; ***P < 0.005; §P < 0.001, compared with saline. Data are presented as mean ± SEM.
Figure 8
Figure 8. ANA-12 demonstrates antidepressant-like properties.
(A) Saline- and ANA-12–treated animals were subjected to the forced-swim test. While saline-treated mice resigned after 4 minutes, mice that received ANA-12 were as active as at the beginning of the test. Two-way ANOVA analysis of the data demonstrated a significant overall effect of the treatment (P < 0.01). (B) This escape behavior was confirmed in the tail-suspension test, as demonstrated by the decrease in immobility (P < 0.001, 2-way ANOVA). Bar graphs show the total immobility time. *P < 0.05; **P = 0.01. Data are presented as mean ± SEM.
Figure 9
Figure 9. The behaviorally effective dose does not affect cell survival.
Representative TUNEL staining in the dentate gyrus of mice subchronically injected with saline or ANA-12 (0.5, 1.0, or 2.0 mg/kg) are shown (Original magnification, (×10). Positive (DNAse-treated sections) and negative (absence of terminal transferase) controls are included for comparison. Arrows show TUNEL-positive cells as microscopically determined under higher magnification (×40). Scale bar: 100 mm.

Comment in

Similar articles

Cited by

References

    1. Yano H, Chao MV. Neurotrophin receptor structure and interactions. Pharm Acta Helv. 2000;74(2–3):253–260. - PubMed
    1. Kaplan DR, Miller FD. Neurotrophin signal trans­duction in the nervous system. Curr Opin Neurobiol. 2000;10(3):381–391. doi: 10.1016/S0959-4388(00)00092-1. - DOI - PubMed
    1. Bramham CR, Messaoudi E. BDNF function in adult synaptic plasticity: the synaptic consolidation hypothesis. Prog Neurobiol. 2005;76(2):99–125. doi: 10.1016/j.pneurobio.2005.06.003. - DOI - PubMed
    1. Lu Y, Christian K, Lu B. BDNF: a key regulator for protein synthesis-dependent LTP and long-term memory? Neurobiol Learn Mem. 2008;89(3):312–323. doi: 10.1016/j.nlm.2007.08.018. - DOI - PMC - PubMed
    1. Graham DL, Edwards S, Bachtell RK, DiLeone RJ, Rios M, Self DW. Dynamic BDNF activity in nucleus accumbens with cocaine use increases self-administration and relapse. Nat Neurosci. 2007;10(8):1029–1037. doi: 10.1038/nn1929. - DOI - PubMed

MeSH terms