

Fractal fronts of diffusion in microgravity
- PMID: 21505446
- PMCID: PMC3220270
- DOI: 10.1038/ncomms1290
Fractal fronts of diffusion in microgravity
Abstract
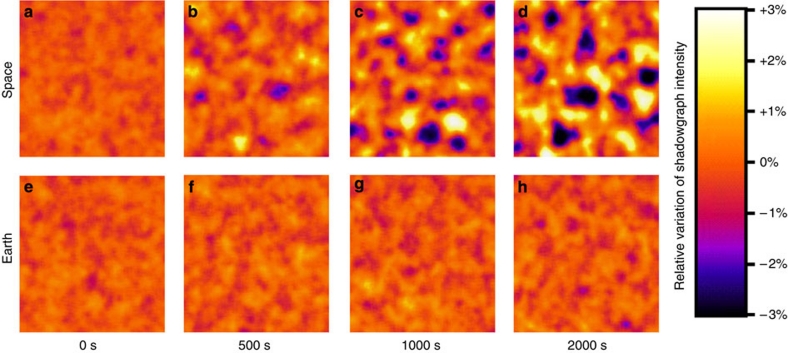
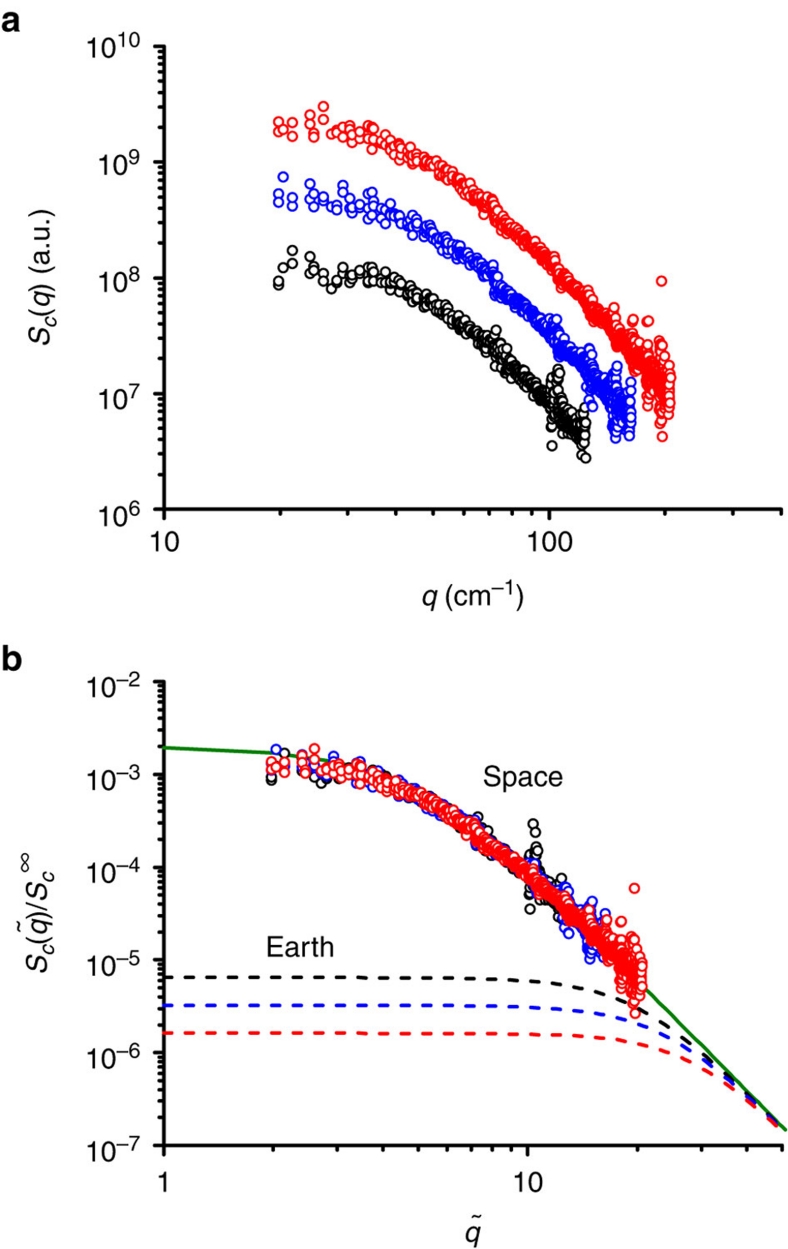
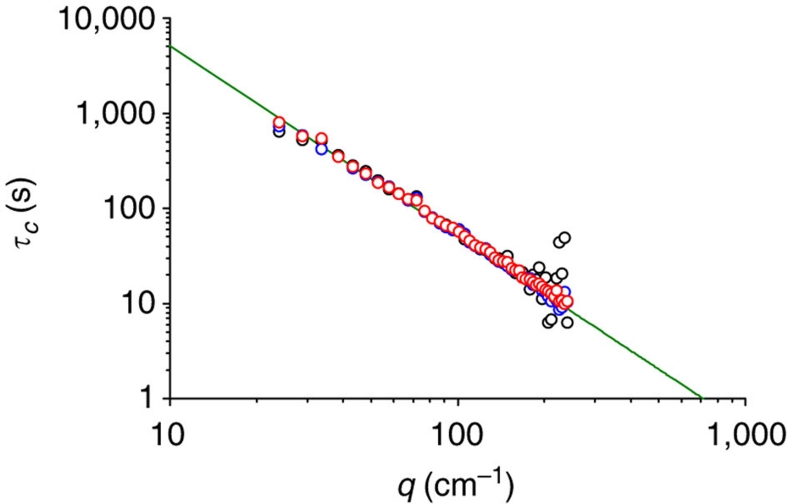
Spatial scale invariance represents a remarkable feature of natural phenomena. A ubiquitous example is represented by miscible liquid phases undergoing diffusion. Theory and simulations predict that in the absence of gravity diffusion is characterized by long-ranged algebraic correlations. Experimental evidence of scale invariance generated by diffusion has been limited, because on Earth the development of long-range correlations is suppressed by gravity. Here we report experimental results obtained in microgravity during the flight of the FOTON M3 satellite. We find that during a diffusion process a dilute polymer solution exhibits scale-invariant concentration fluctuations with sizes ranging up to millimetres, and relaxation times as large as 1,000 s. The scale invariance is limited only by the finite size of the sample, in agreement with recent theoretical predictions. The presence of such fluctuations could possibly impact the growth of materials in microgravity.
Figures
References
-
- Lagues M. & Lesne A. Invariances d'Echelle (Belin, 2003).
-
- Ball P. Branches, Nature Patterns, a Tapestry in Three Parts (Oxford University, 2009).
-
- Sornette D. Critical Phenomena in Natural Sciences (Springer, 2000).
-
- Barmatz M., Hahn I., Lipa J. A. & Duncan R. V. Critical phenomena in microgravity: past, present and future. Rev. Mod. Phys. 79, 1–52 (2007).
-
- Grinstein G. in Scale Invariance, Interfaces, and Non-Equilibrium Dynamics (eds Mckane, A. et al..) 261–293 (Plenum Press, 1995).
MeSH terms
Substances
LinkOut - more resources
Full Text Sources
