

Geographic differences in allele frequencies of susceptibility SNPs for cardiovascular disease
- PMID: 21507254
- PMCID: PMC3103418
- DOI: 10.1186/1471-2350-12-55
Geographic differences in allele frequencies of susceptibility SNPs for cardiovascular disease
Abstract
Background: We hypothesized that the frequencies of risk alleles of SNPs mediating susceptibility to cardiovascular diseases differ among populations of varying geographic origin and that population-specific selection has operated on some of these variants.
Methods: From the database of genome-wide association studies (GWAS), we selected 36 cardiovascular phenotypes including coronary heart disease, hypertension, and stroke, as well as related quantitative traits (eg, body mass index and plasma lipid levels). We identified 292 SNPs in 270 genes associated with a disease or trait at P < 5 × 10⁻⁸. As part of the Human Genome-Diversity Project (HGDP), 158 (54.1%) of these SNPs have been genotyped in 938 individuals belonging to 52 populations from seven geographic areas. A measure of population differentiation, F(ST), was calculated to quantify differences in risk allele frequencies (RAFs) among populations and geographic areas.
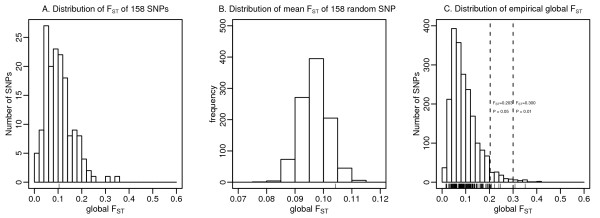
Results: Large differences in RAFs were noted in populations of Africa, East Asia, America and Oceania, when compared with other geographic regions. The mean global F(ST) (0.1042) for 158 SNPs among the populations was not significantly higher than the mean global F(ST) of 158 autosomal SNPs randomly sampled from the HGDP database. Significantly higher global F(ST) (P < 0.05) was noted in eight SNPs, based on an empirical distribution of global F(ST) of 2036 putatively neutral SNPs. For four of these SNPs, additional evidence of selection was noted based on the integrated Haplotype Score.
Conclusion: Large differences in RAFs for a set of common SNPs that influence risk of cardiovascular disease were noted between the major world populations. Pairwise comparisons revealed RAF differences for at least eight SNPs that might be due to population-specific selection or demographic factors. These findings are relevant to a better understanding of geographic variation in the prevalence of cardiovascular disease.
Figures
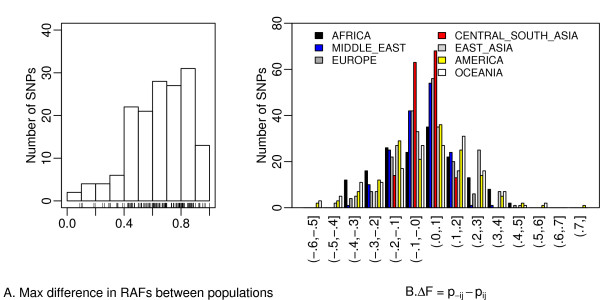
 ) for the comparison of a given tested region (eg, Africa) versus the rest of the world. Negative ΔF indicates that the risk allele has a higher frequency within the tested population than in the rest of the world (see methods section for the denotation of
  and
and  ).
).

References
-
- Keys A. Coronary heart disease in seven countries. Circulation. 1970;41(4 Suppl):1–211. - PubMed
-
- Anand SS, Yusuf S, Vuksan V, Devanesen S, Teo KK, Montague PA, Kelemen L, Yi C, Lonn E, Gerstein H. et al.Differences in risk factors, atherosclerosis, and cardiovascular disease between ethnic groups in Canada: the Study of Health Assessment and Risk in Ethnic groups (SHARE) Lancet. 2000;356(9226):279–284. doi: 10.1016/S0140-6736(00)02502-2. - DOI - PubMed
MeSH terms
LinkOut - more resources
Full Text Sources
Research Materials
Miscellaneous
