. 2011 Aug;25(8):2551-62.
doi: 10.1096/fj.10-177816. Epub 2011 Apr 20.

Bone proteins PHEX and DMP1 regulate fibroblastic growth factor Fgf23 expression in osteocytes through a common pathway involving FGF receptor (FGFR) signaling

Affiliations

Bone proteins PHEX and DMP1 regulate fibroblastic growth factor Fgf23 expression in osteocytes through a common pathway involving FGF receptor (FGFR) signaling

Aline Martin et al. FASEB J. 2011 Aug.

Abstract

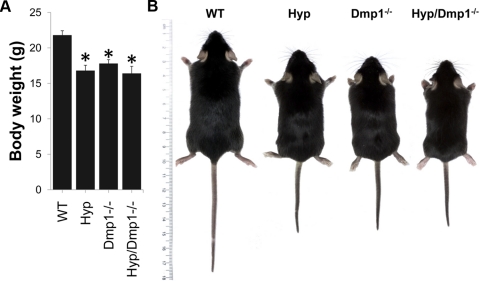
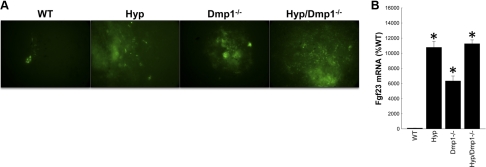
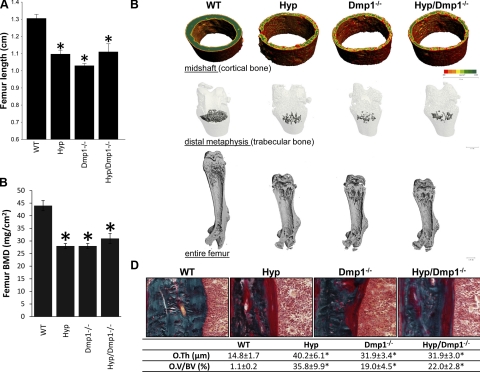
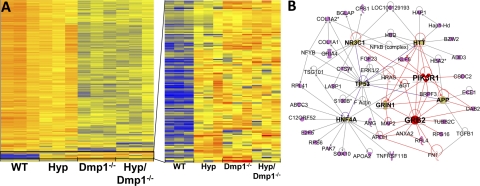
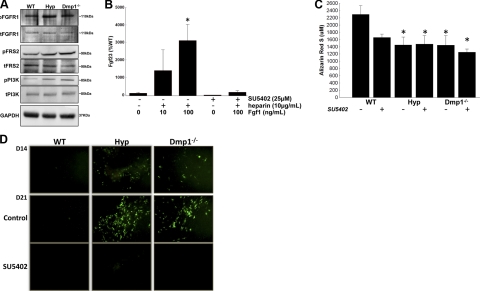
Fibroblastic growth factor 23 (FGF23) is a circulating phosphaturic hormone. Inactivating mutations of the endopeptidase PHEX or the SIBLING protein DMP1 result in equivalent intrinsic bone mineralization defects and increased Fgf23 expression in osteocytes. The mechanisms whereby PHEX and DMP1 regulate Fgf23 expression are unknown. We examined the possibility that PHEX and DMP1 regulate Fgf23 through a common pathway by analyzing the phenotype of compound Phex and Dmp1 mutant mice (Hyp/Dmp1(-/-)). Compared to single-mutant littermates, compound-mutant Hyp/Dmp1(-/-) mice displayed nonadditive elevations of serum FGF23 (1912 ± 183, 1715 ± 178, and 1799 ± 181 pg/ml), hypophosphatemia (P(i): 6.0 ± 0.3, 5.8 ± 0.2, and 5.4 ± 0.1 mg/dl), and severity of rickets/osteomalacia (bone mineral density: -36, -36, and -30%). Microarray analysis of long bones identified gene expression profiles implicating common activation of the FGFR pathway in all the mutant groups. Furthermore, inhibiting FGFR signaling using SU5402 in Hyp- and Dmp1(-/-)-derived bone marrow stromal cells prevented the increase in Fgf23 mRNA expression (129- and 124-fold increase in Hyp and Dmp1(-/-) vs. 1.3-fold in Hyp+SU5402 and 2.5-fold in Dmp1(-/-)+SU5402, P<0.05). For all analyses, samples collected from nonmutant wild-type littermates served as controls. These findings indicate that PHEX and DMP1 control a common pathway regulating bone mineralization and FGF23 production, the latter involving activation of the FGFR signaling in osteocytes.


Figures

Figure 1.
Figure 1.
Body weight (A) and gross appearance (B) of 5-wk-old WT, Phex-deficient (Hyp), Dmp1-deficient (Dmp1−/−), and compound mutant (Hyp/Dmp1−/−) mice. Values are expressed as means ± se; n = 8 mice/group. *P < 0.05 vs. WT.
Figure 2.
Figure 2.
A) Expression of eGFP driven by Fgf23 promoter in BMSCs collected from WT, Hyp, Dmp1−/−, and Hyp/Dmp1−/− mice lacking 1 allele of Fgf23 (Fgf23+/−[eGFP]) and cultured in osteoblast differentiating medium for 3 wk. Expression is reported after 3 wk of culture, showing intrinsic increase of Fgf23 expression by nodule-embedded cells in all 3 mutant groups compared to WT. B) mRNA expression of Fgf23 in calvariae. Values are expressed as mean ± se percentage relative to WT; n = 5 mice/group. *P < 0.05 vs. WT control; 1-way ANOVA and post hoc Fisher test.
Figure 3.
Figure 3.
Bone phenotype of 5-wk-old WT, Hyp, Dmp1−/−, and Hyp/Dmp1−/− mutant mice. A) Entire femur length. B) BMD (DEXA). C) Three-dimensional microCT representation of cortical bone (top), trabecular bone (middle) and entire femur (bottom). Degree of mineralization is represented on the cortical bone using a color scale from less mineralized (red) to more mineralized (green). D) Top panels: modified Goldner staining on femur histological section showing the cortical bone area. Bottom panel: histomorphometric quantification of osteoid thickness (O.Th.) and volume (OV/BV) measured in cortical bone. Values are expressed as means ± se; n ≥ 5 mice/group. *P < 0.05 vs. WT.
Figure 4.
Figure 4.
A) Left panel: cluster analysis of microarray performed on cortical bone from 12-d-old WT, Hyp, Dmp1−/−, and Hyp/Dmp1−/− mice. Gene expression is represented on the heat map from the less expressed (blue) to the more expressed (red) on 3 samples per group. Right panel: cluster showing nonadditive effects of both Phex and Dmp1 mutations on downstream gene expression, indicating up-regulation through a common pathway. B) Ingenuity pathway analysis of listed genes belonging to the identified cluster. Network is built according the identified interconnected pathways involving the highest majority of genes of the selected cluster. This network represents genes involved in direct interactions only. Genes in pink belong to the cluster. Genes in bold font are central regulators of the identified pathways that do not belong to the cluster [glucocorticoid receptor, also known as nuclear receptor subfamily 3 group C member 1 (NR3C1); Huntingtin (HTT); tumor protein p53 (TP53); phosphatidylinositol 3-kinase regulatory α subunit (PIK3R1); glutamate (NMDA) receptor subunit ζ-1 (GRIN1); amyloid precursor protein (APP); hepatocyte nuclear factor 4 α (HNF4A); growth factor receptor-bound protein 2 (GRB2)]. Genes represented in white are other intermediary regulators that do not belong to the cluster. Genes and pathways directly connected to GRB2 and PIK3R1 are highlighted in red as candidates possibly involved in the regulation of the FGFR activation. Nomenclature of the shapes used for the different genes is provided online (https://analysis.ingenuity.com/pa/info/help/help.htm#legend.htm).
Figure 5.
Figure 5.
Rescue of the Fgf23 promoter activity in Hyp and Dmp1−/− by inhibition of FGFR1. A) Western blots showing activation of the FGFR1 pathway in Hyp and Dmp1−/− cortical bone compared to WT. B) WT BMSCs were treated with heparin, Fgf1, and/or SU5402 as indicated for the last 24 h of the 3-wk culture period. Graph shows Fgf23 mRNA expression measured by RT-PCR. Values are expressed as percentage of control value (set at 100%). C, D) BMSCs were collected from WT, Hyp, and Dmp1−/− mice lacking 1 allele of Fgf23 (Fgf23+/−[eGFP]) and cultured in osteoblast differentiating medium for 3 wk (control). An FGFR1-specific inhibitor (SU5402) was added to the medium during the third week of culture. C) Spectrophotometric quantification of alizarin red S staining performed at the end of the culture period. D) Expression of eGFP driven by Fgf23 promoter. EGFP expression is reported before (D14) and after (D21) SU5402 treatment. All experiments were performed in triplicate. *P < 0.05 vs. control; 1-way ANOVA and post hoc Fisher test.

References

    1. Suzuki M., Uehara Y., Motomura-Matsuzaka K., Oki J., Koyama Y., Kimura M., Asada M., Komi-Kuramochi A., Oka S., Imamura T. (2008) βKlotho is required for fibroblast growth factor (FGF) 21 signaling through FGF receptor (FGFR) 1c and FGFR3c. Mol. Endocrinol. 22, 1006–1014 - PMC - PubMed
    1. Itoh N., Ornitz D. M. (2004) Evolution of the Fgf and Fgfr gene families. Trends Genet. 20, 563–569 - PubMed
    1. Yamashita T., Yoshioka M., Itoh N. (2000) Identification of a novel fibroblast growth factor, FGF-23, preferentially expressed in the ventrolateral thalamic nucleus of the brain. Biochem. Biophys. Res. Commun. 277, 494–498 - PubMed
    1. Kurosu H., Ogawa Y., Miyoshi M., Yamamoto M., Nandi A., Rosenblatt K. P., Baum M. G., Schiavi S., Hu M. C., Moe O. W., Kuro-o M. (2006) Regulation of fibroblast growth factor-23 signaling by klotho. J. Biol. Chem. 281, 6120–6123 - PMC - PubMed
    1. Urakawa I., Yamazaki Y., Shimada T., Iijima K., Hasegawa H., Okawa K., Fujita T., Fukumoto S., Yamashita T. (2006) Klotho converts canonical FGF receptor into a specific receptor for FGF23. Nature 444, 770–774 - PubMed

Publication types

MeSH terms

Substances