. 2011 Jun 15;71(12):4106-16.
doi: 10.1158/0008-5472.CAN-10-3597. Epub 2011 Apr 20.

Nonredundant functions for Akt isoforms in astrocyte growth and gliomagenesis in an orthotopic transplantation model

Affiliations

Nonredundant functions for Akt isoforms in astrocyte growth and gliomagenesis in an orthotopic transplantation model

Raelene Endersby et al. Cancer Res. .

Abstract

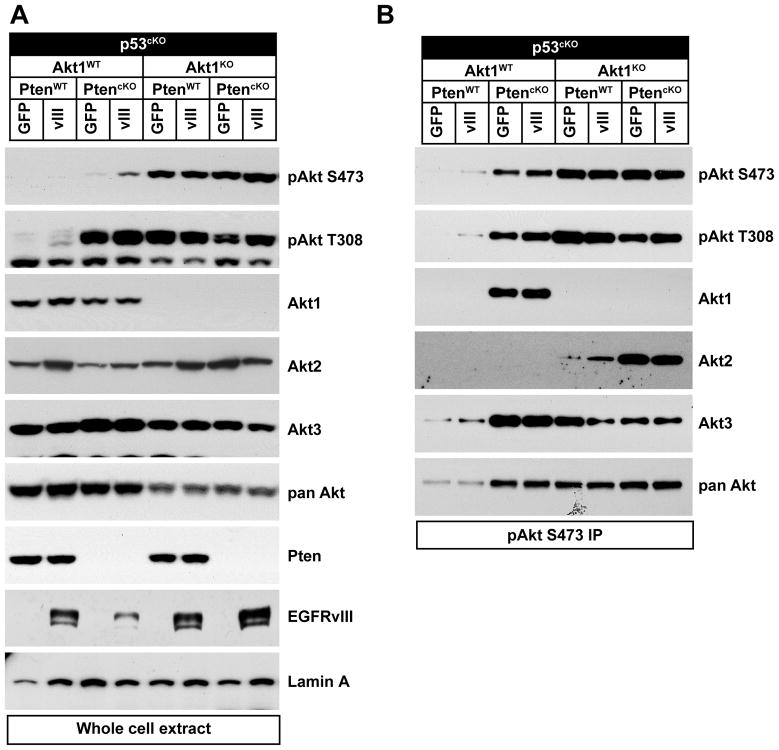
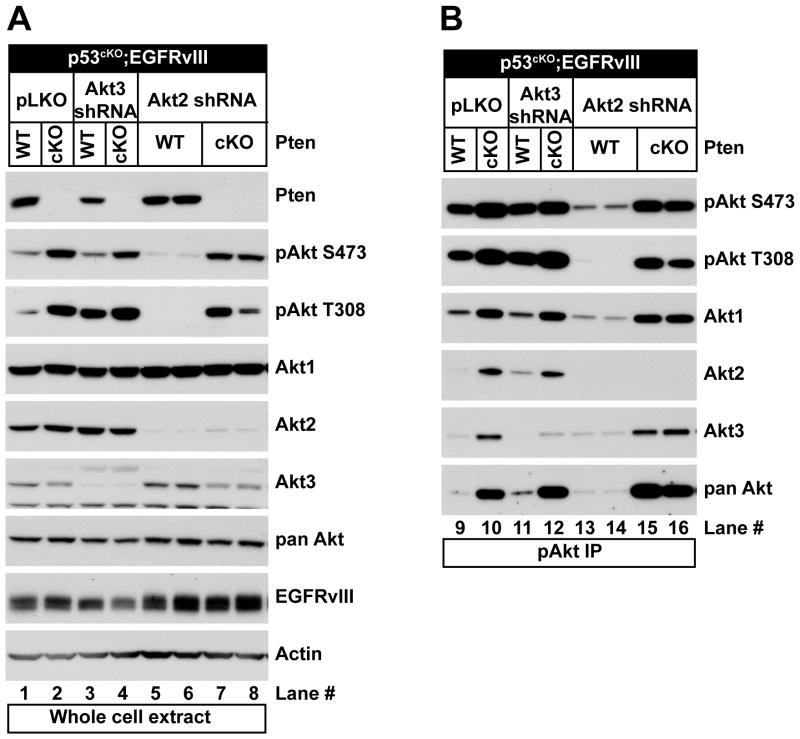
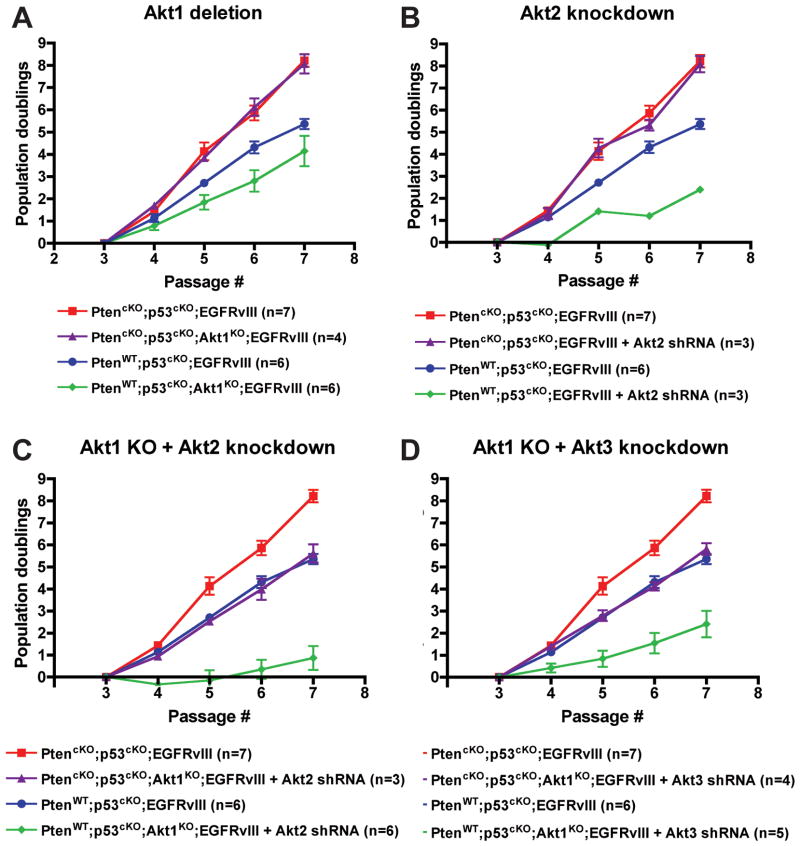
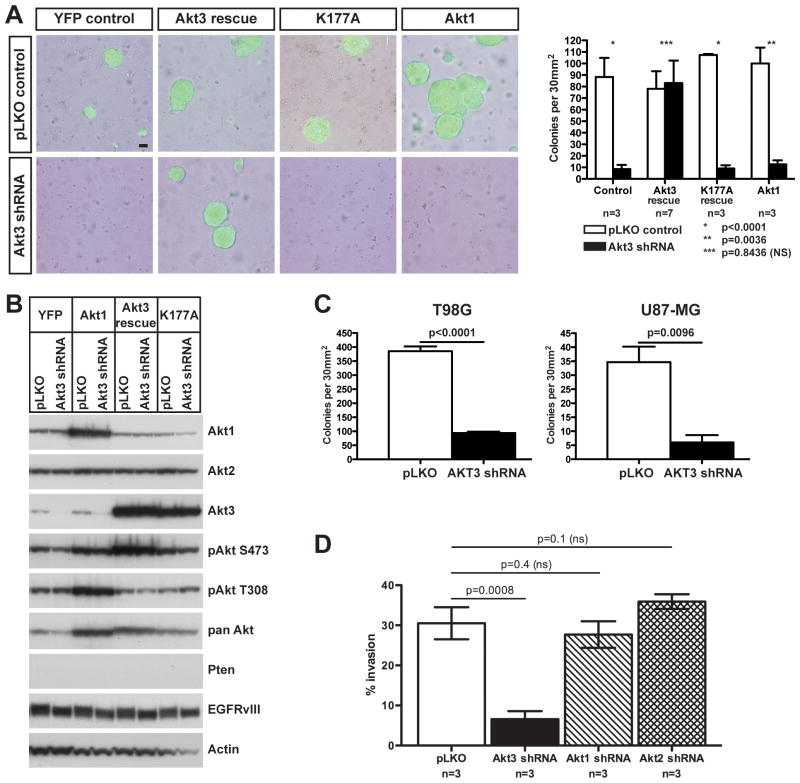
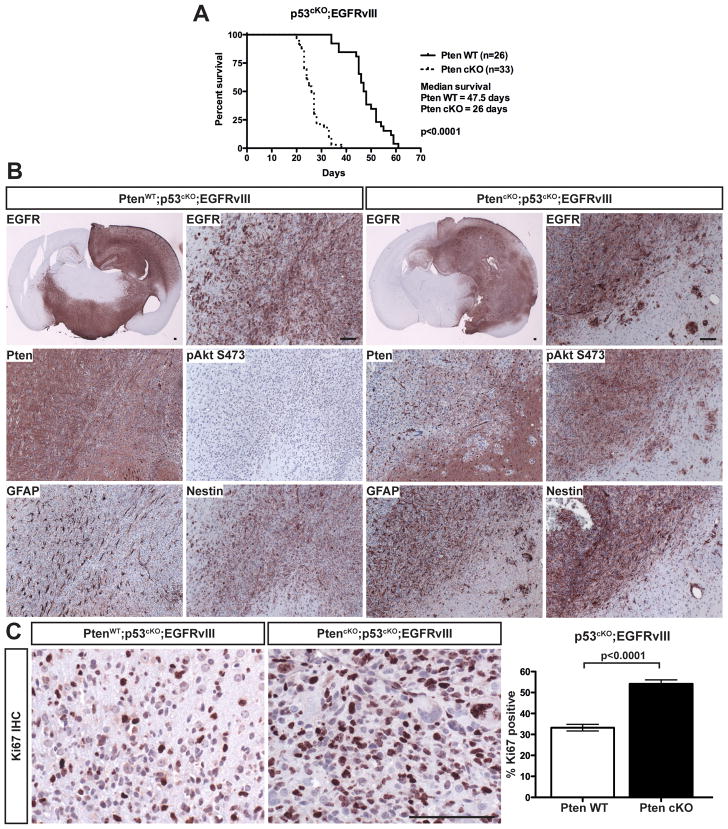
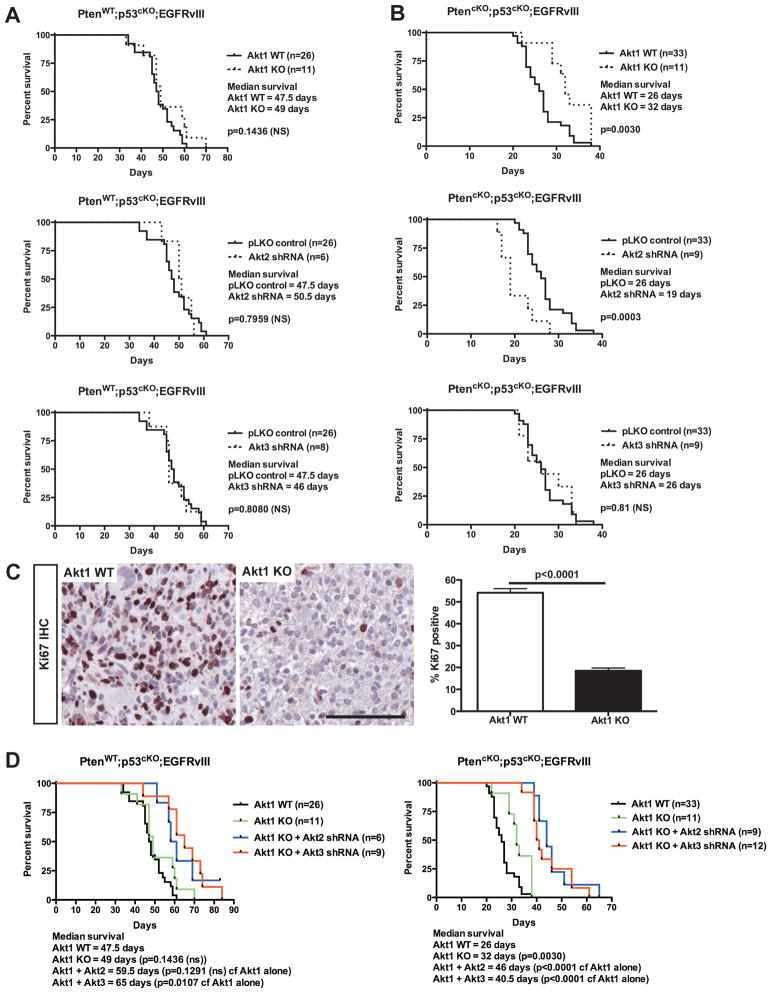
The AKT family, comprising three highly homologous kinases, is an essential mediator of the PTEN/PI3K pathway, which is deregulated in many human cancers. A thorough understanding of the specific activities of each isoform in normal and disease tissues is lacking. We evaluated the role of each Akt isoform in gliomagenesis by using a model system driven by common glioma abnormalities, loss of function of p53 and Pten, and expression of EGFRvIII. Both Pten deletion and EGFRvIII expression accelerated the proliferation of p53-null primary murine astrocytes. All three Akt isoforms were expressed and phosphorylated in astrocytes, with significantly higher activation in Pten-null cells. Despite substantial compensation in many contexts when individual Akt isoforms were inhibited, isoform-specific effects were also identified. Specifically, loss of Akt1 or Akt2 decreased proliferation of Pten wild-type astrocytes, whereas combined loss of multiple isoforms was needed to inhibit proliferation of Pten-null astrocytes. In addition, Akt3 was required for anchorage-independent growth of transformed astrocytes and human glioma cells, and Akt3 loss inhibited invasion of transformed astrocytes. EGFRvIII expression transformed p53-null astrocytes with or without Pten deletion, causing rapid development of high-grade astrocytoma on intracranial transplantation. Furthermore, tumorigenesis of Pten;p53-null astrocytes expressing EGFRvIII was delayed by Akt1 loss and accelerated by Akt2 loss. Taken together, these results indicate context-dependent roles for individual Akt isoforms and suggest that there may be heterogeneous tumor response to isoform-specific inhibitors.


Conflict of interest statement

The authors declare no conflict of interest.

Figures

Figure 1
Figure 1. All Akt isoforms were expressed in primary astrocytes
PMAs were isolated from p53cKO or PtencKO;p53cKO mice with or without Akt1 deletion (Akt1 KO) and transduced with control (GFP) or EGFRvIII (vIII) expressing retrovirus. (A) Immunoblots were performed with the indicated antibodies. (B) Phospho-Akt (S473) immunoprecipitates were immunoblotted as indicated.
Figure 2
Figure 2. Redundancy of Akt isoforms phosphorylated in primary astrocytes
(A) Western blot analyses using the indicated antibodies of PMAs isolated from p53cKO or PtencKO;p53cKO mice expressing EGFRvIII (vIII) that were transduced with control lentivirus (pLKO) or lentivirus expressing Akt3-specific or Akt2-specific shRNA. (B) Phospho-Akt (S473) immunoprecipitates of the same lysates were immunoblotted as indicated.
Figure 3
Figure 3. Akt1 and Akt2 predominantly affected PMA proliferation
Growth of p53cKO;EGFRvIII PMAs was measured in Pten wildtype (WT) or deficient (cKO) cells that were (A) Akt1 WT or KO (B) Akt1 WT expressing Akt2-specific shRNA, or Akt1 KO expressing (C) Akt2-specific or (D) Akt3-specific shRNA. Plotted are the mean cumulative population doublings ± SEM. n= number of individual cultures per group.
Figure 4
Figure 4. Akt3 regulated anchorage-independent growth and invasiveness of PMAs and GBM cells
(A) PtencKO;p53cKO;EGFRvIII PMAs were transduced with control (pLKO) or Akt3 shRNA-expressing lentivirus along with control (YFP) or retrovirus over-expressing Akt3 or kinase-dead Akt3 transcripts resistant to the shRNA (Akt3 rescue and K177A) or Akt1. Anchorage-independent growth was assessed by plating in soft agar. Left: Overlays of phase contrast and GFP fluorescence of representative colonies after 10 days. Scale bar = 50 μm. Right: Quantification, n= number of individual cultures per group. (B) Western analyses of cells in (A) using the indicated antibodies prior to plating in soft agar. (C) Quantification of colonies formed after human GBM cell lines T98G and U87-MG were transduced with control (pLKO) or AKT3-specific shRNA lentivirus and plated in agar from three independent experiments. (D) Akt3, but not Akt1 or Akt2, knockdown decreased invasion of PtencKO;p53cKO;EGFRvIII PMAs. Quantification of cell invasion through matrigel in a Boyden chamber from three independently isolated cultures. Graphs in A, C and D indicate mean ± SEM and significance values (p) were calculated using unpaired t-tests.
Figure 5
Figure 5. Transformed PMAs formed high-grade astrocytoma following orthotopic transplantation
(A) Kaplan-Meier curves of mice following implantation of p53cKO;EGFRvIII PMAs with or without Pten deletion. (B) IHC analysis of representative tumors from (A). Sections were stained for human EGFR (shown at low and high magnification), Pten, pAkt (S473), Gfap and Nestin. (C) Left: IHC for Ki67 in p53cKO;EGFRvIII tumors with or without Pten. Right: Quantification of Ki67 positive cells. Shown is the mean ± SEM. Bars in A and C are 100 μm.
Figure 6
Figure 6. Loss of Akt1 and Akt2 had opposing effects on latency of Pten deficient tumors
Kaplan-Meier curves of mice following intracranial implantation of (A) PtenWT;p53cKO;EGFRvIII or (B) PtencKO;p53cKO;EGFRvIII PMAs that were (upper) Akt1 WT or KO, or treated with (middle) Akt2- or (lower) Akt3-shRNAs. (C) Left: IHC for Ki67 (brown) was performed on PtencKO;p53cKO;EGFRvIII tumors from (B, upper) and counterstained with hematoxylin (blue). Bar is 100 μm. Right: Quantification of Ki67 positive cells. Shown is the mean ± SEM. The significance value (p) was determined using an unpaired t test. (D) Kaplan-Meier curves of mice following intracranial implantation of (left) PtenWT;p53cKO;EGFRvIII or (right) PtencKO;p53cKO;EGFRvIII PMAs that were Akt1WT (black), Akt1KO (green) or Akt1KO expressing (blue) Akt2 or (red) Akt3 shRNAs. For A, B and D, n=number of mice per group and p values were calculated using the logrank test.

References

    1. Louis DN, Ohgaki H, Wiestler OD, Cavenee WK, editors. WHO classification of tumours of the central nervous system. 4. Lyon: International agency for research on cancer; 2007. - PMC - PubMed
    1. The Cancer Genome Atlas. Comprehensive genomic characterization defines human glioblastoma genes and core pathways. Nature. 2008;455:1061–8. - PMC - PubMed
    1. Parsons DW, Jones S, Zhang X, et al. An integrated genomic analysis of human glioblastoma multiforme. Science. 2008;321:1807–12. - PMC - PubMed
    1. Wong AJ, Bigner SH, Bigner DD, Kinzler KW, Hamilton SR, Vogelstein B. Increased expression of the epidermal growth factor receptor gene in malignant gliomas is invariably associated with gene amplification. Proc Natl Acad Sci U S A. 1987;84:6899–903. - PMC - PubMed
    1. Moscatello DK, Holgado-Madruga M, Emlet DR, Montgomery RB, Wong AJ. Constitutive activation of phosphatidylinositol 3-kinase by a naturally occurring mutant epidermal growth factor receptor. J Biol Chem. 1998;273:200–6. - PubMed

Publication types

MeSH terms