. 2011 Jul 22;286(29):25973-82.
doi: 10.1074/jbc.M111.228841. Epub 2011 Apr 20.

Sulfatases and a radical S-adenosyl-L-methionine (AdoMet) enzyme are key for mucosal foraging and fitness of the prominent human gut symbiont, Bacteroides thetaiotaomicron

Affiliations

Sulfatases and a radical S-adenosyl-L-methionine (AdoMet) enzyme are key for mucosal foraging and fitness of the prominent human gut symbiont, Bacteroides thetaiotaomicron

Alhosna Benjdia et al. J Biol Chem. .

Abstract

The large-scale application of genomic and metagenomic sequencing technologies has yielded a number of insights about the metabolic potential of symbiotic human gut microbes. Nevertheless, the molecular basis of the interactions between commensal bacteria and their host remained to be investigated. Bacteria colonizing the mucosal layer that overlies the gut epithelium are exposed to highly sulfated glycans (i.e. mucin and glycosaminoglycans). These polymers can serve as potential nutrient sources, but their high sulfate content usually prevents their degradation. Commensal bacteria such as Bacteroides thetaiotaomicron possess more predicted sulfatase genes than in the human genome, the physiological functions of which are largely unknown. To be active, sulfatases must undergo a critical post-translational modification catalyzed in anaerobic bacteria by the radical AdoMet enzyme anaerobic sulfatase-maturating enzyme (anSME). In the present study, we have tested the role of this pathway in Bacteroides thetaiotaomicron which, in addition to 28 predicted sulfatases, possesses a single predicted anSME. In vitro studies revealed that deletion of the gene encoding its anSME (BT0238) results in loss of sulfatase activity and impaired ability to use sulfated polysaccharides as carbon sources. Co-colonization of formerly germ-free mice with both isogenic strains (i.e. wild-type or ΔanSME), or invasion experiments involving introduction of one followed by the other strain established that anSME activity and the sulfatases activated via this pathway, are important fitness factors for B. thetaiotaomicron, especially when mice are fed a simple sugar diet that requires this saccharolytic bacterium to adaptively forage on host glycans as nutrients. Whole genome transcriptional profiling of wild-type and the anSME mutant in vivo revealed that loss of this enzyme alters expression of genes involved in mucin utilization and that this disrupted ability to access mucosal glycans likely underlies the observed pronounced colonization defect. Comparative genomic analysis reveals that 100% of 46 fully sequenced human gut Bacteroidetes contain homologs of BT0238 and genes encoding sulfatases, suggesting that this is an important and evolutionarily conserved feature for bacterial adaptation to life in this habitat.


Figures

FIGURE 1.
FIGURE 1.
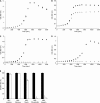
Comparison of growth properties of wild-type and isogenic ΔanSME strains of B. thetaiotaomicron VPI-5482 in vitro and in vivo. A, PCR amplification of the −300 and +300 bp region surrounding the B. thetaiotaomicron anSME gene in WT and ΔanSME strains (Δ). B, growth curves of wild-type (■) and the ΔanSME (◊) cells in BHI medium. Monocolonization of 8-week-old male C57BL/6J germ-free mice with the wild-type strain (each mouse represented by a different closed symbol; ■, ♦, or ▴) or the isogenic ΔanSME strain (□, ◊, △). The dashed blue line represents the average colonization levels achieved with the wild-type strain, whereas the dashed red line represents results obtained with the isogenic ΔanSME strain. Mice were fed a standard plant glycan-rich diet (C) or a diet containing simple sugars (glucose/sucrose) (D). The representation of each strain at the indicated times following gavage was determined by the qPCR assay.
FIGURE 2.
FIGURE 2.
Competition experiments in C57BL/6J germ-free mice co-inoculated with both wild-type and ΔanSME strains. Mice were fed a standard plant glycan-rich diet (A, time series experiment; B, time point analysis after 11 days; C, strains ratio in percentages) or a simple sugar diet (D, time series experiment; E, time point analysis after 11 days; F, strains ratio in percentages). Each mouse is represented by a different symbol (filled symbols, wild-type strain; open symbols, ΔanSME mutant strain). The dashed blue line indicates the average colonization levels achieved with the wild-type strain, whereas the red line represents the average colonization densities obtained with the ΔanSME strain. An asterisk indicates that the difference in levels between strains at a given time point are statistically significant (p < 0.02 Student's t test). G, in vitro competition experiment in BHI medium. Both wild-type (■) and ΔanSME (□) strains were mixed in a 1:1 ratio and grown in BHI medium. After daily serial passages, each strain was quantified using qPCR (see supplemental Table S2). Overnight cultures were subcultured daily into fresh medium at a 1:100 dilution. The experiment was performed in duplicate.
FIGURE 3.
FIGURE 3.
Growth curves of wild-type (■) and ΔanSME (◊) B. thetaiotaomicron strains in MM containing glucose (A), mucins (B), chondroitin (C), or heparin (D) as the sole carbon source are shown. Each experiment was performed in triplicate. Mean values ± S.D. are shown for each time point. E, ratio of growth (A600 ratio) of wild-type (■) versus ΔanSME (□) mutant strains in the indicated media, as assayed at early stationary phase. Mean values ± S.D. are plotted. An asterisk indicates that the difference between strains is statistically significant at p < 0.01 (Student's t test).
FIGURE 4.
FIGURE 4.
Sulfatase activity in Bacteroides thetaiotaomicron WT and ΔanSME strains assayed on the synthetic substrate p-nitrophenyl sulfate. Activity is expressed in mol·min−1·mg−1 of protein extract. Mean values ± S.D. are plotted. Differences between the wild-type strain grown on BHI medium or MM-glucose compared with MM-chondroitin, MM-heparin, and MM-porcine gastric mucin were statistically significant (p < 0.01, Student's t test). The ΔanSME strain was not assayed in MM-heparin or MM-chondroitin, which did not support growth.
FIGURE 5.
FIGURE 5.
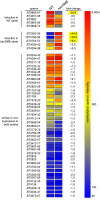
Differential expression of host glycan utilization genes in wild-type and ΔanSME strains in mono-associated gnotobiotic mice consuming a simple sugar diet. The heat map shows normalized in vivo expression intensity for 33 B. thetaiotaomicron VPI-5482 gene clusters implicated in utilization of host-derived glycans. Genes contained in each operon are listed vertically in the column (operon). All operons shown, except BT3796–99 (marked with an asterisk), are components of susC/D-containing PULs. Notably, the BT3796–99 locus is associated with a hybrid two-component system regulator and encodes enzymatic functions, one glycoside hydrolase and two sulfatases, suggesting that it is functionally similar to B. thetaiotaomicron PULs but lacks the defining susC/susD homologs. Three loci with higher expression in the wild-type strain and five loci with higher expression in isogenic ΔanSME cells are separated at the top of the figure. Average fold change values for each operon are given to the right of the heat map. Negative numbers indicate lower expression in the ΔanSME mutant, and positive numbers indicate increased expression in the mutant. Fold change values for the four loci with greatest expression changes are highlighted in yellow. Intensity values are calibrated according to the color bar at the right and range from 50–5000; note that the scale is not linear.
FIGURE 6.
FIGURE 6.
Invasion experiment designed to assess the relative fitness of the wild-type and mutant strains in the distal gut of gnotobiotic C57BL/6J mice fed the plant-glycan rich diet. Mice were colonized first with the wild-type strain (A) or the ΔanSME strain (B), or both strains (C) (n = 3 mice/group). After 11 days, mono-associated mice were inoculated with a single gavage of either the ΔanSME strain (arrow in A) or the wild-type strain (arrow in B). Each mouse is represented by a symbol (■, ♦, or ▴). The blue dashed line represents average colonization levels attained by the wild-type strain, whereas the dashed red line represents average colonization levels observed with the ΔanSME strain. Data obtained by qPCR assay from the wild-type strain are denoted by filled symbols, whereas data for the ΔanSME mutant is shown as open symbols. Asterisk, difference between strains is statistically significant at a p < 0.02 (Student's t test).
FIGURE 7.
FIGURE 7.
Phylogenetic tree and potential functions of sulfatases found in B. thetaiotaomicron VPI 5482. Purple, sulfatases induced in vitro in presence of glycosaminoglycans; orange, sulfatase induced in vivo and in vitro in presence of mucin; red and blue, sulfatases induced only in vivo based on a previous (8) or the current study in the ΔanSME strain, respectively. Sequence alignment was performed with ClustalW. The phylogenetic tree was generated using the program Mega and the neighbor-joining method with the Kimura two-parameter calculation model. An open star indicates that the protein contains a predicted signal peptidase I cleavage site, and a filled star indicates that the protein contains a predicted signal peptidase II cleavage site, whereas a gray star indicates ambiguity in prediction based on SignalP (version 3.0) or LipoP (version 1.0).

Similar articles

Cited by

References

    1. Qin J., Li R., Raes J., Arumugam M., Burgdorf K. S., Manichanh C., Nielsen T., Pons N., Levenez F., Yamada T., Mende D. R., Li J., Xu J., Li S., Li D., Cao J., Wang B., Liang H., Zheng H., Xie Y., Tap J., Lepage P., Bertalan M., Batto J. M., Hansen T., Le Paslier D., Linneberg A., Nielsen H. B., Pelletier E., Renault P., Sicheritz-Ponten T., Turner K., Zhu H., Yu C., Li S., Jian M., Zhou Y., Li Y., Zhang X., Li S., Qin N., Yang H., Wang J., Brunak S., Doré J., Guarner F., Kristiansen K., Pedersen O., Parkhill J., Weissenbach J., Bork P., Ehrlich S. D., Wang J. (2010) Nature 464, 59–65 - PMC - PubMed
    1. Turnbaugh P. J., Hamady M., Yatsunenko T., Cantarel B. L., Duncan A., Ley R. E., Sogin M. L., Jones W. J., Roe B. A., Affourtit J. P., Egholm M., Henrissat B., Heath A. C., Knight R., Gordon J. I. (2009) Nature 457, 480–484 - PMC - PubMed
    1. Turnbaugh P. J., Quince C., Faith J. J., McHardy A. C., Yatsunenko T., Niazi F., Affourtit J., Egholm M., Henrissat B., Knight R., Gordon J. I. (2010) Proc. Natl. Acad. Sci. U.S.A. 107, 7503–7508 - PMC - PubMed
    1. Gloux K., Berteau O., El Oumami H., Béguet F., Leclerc M., Doré J. (2011) Proc. Natl. Acad. Sci. U.S.A. 108, 4539–4546 - PMC - PubMed
    1. Goodman A. L., McNulty N. P., Zhao Y., Leip D., Mitra R. D., Lozupone C. A., Knight R., Gordon J. I. (2009) Cell Host. Microbe. 6, 279–289 - PMC - PubMed

Publication types

MeSH terms