. 2011 Jul;85(13):6205-11.
doi: 10.1128/JVI.00252-11. Epub 2011 Apr 20.

Analysis of HIV-1 expression level and sense of transcription by high-throughput sequencing of the infected cell

Affiliations

Analysis of HIV-1 expression level and sense of transcription by high-throughput sequencing of the infected cell

Gregory Lefebvre et al. J Virol. 2011 Jul.

Abstract

Next-generation sequencing offers an unprecedented opportunity to jointly analyze cellular and viral transcriptional activity without prerequisite knowledge of the nature of the transcripts. SupT1 cells were infected with a vesicular stomatitis virus G envelope protein (VSV-G)-pseudotyped HIV vector. At 24 h postinfection, both cellular and viral transcriptomes were analyzed by serial analysis of gene expression followed by high-throughput sequencing (SAGE-Seq). Read mapping resulted in 33 to 44 million tags aligning with the human transcriptome and 0.23 to 0.25 million tags aligning with the genome of the HIV-1 vector. Thus, at peak infection, 1 transcript in 143 is of viral origin (0.7%), including a small component of antisense viral transcription. Of the detected cellular transcripts, 826 (2.3%) were differentially expressed between mock- and HIV-infected samples. The approach also assessed whether HIV-1 infection modulates the expression of repetitive elements or endogenous retroviruses. We observed very active transcription of these elements, with 1 transcript in 237 being of such origin, corresponding on average to 123,123 reads in mock-infected samples (0.40%) and 129,149 reads in HIV-1-infected samples (0.45%) mapping to the genomic Repbase repository. This analysis highlights key details in the generation and interpretation of high-throughput data in the setting of HIV-1 cellular infection.


Figures
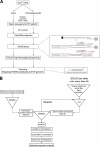
Fig. 1.
Fig. 1.
Overview of experimental and analytical procedures. (A) Experimental pipeline. (B) Bioinformatics pipeline.
Fig. 2.
Fig. 2.
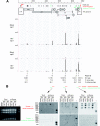
Distribution of HIV-specific tags along the viral genome. (A) The HIV vector genome is depicted at the top, and nucleotide positioning, NlaIII restriction sites (vertical black bars), the common sense transcription start site (TSS; red arrow), and the polyadenylation signal [poly(A); red vertical bar] are shown below. Multiple antisense transcription start sites (distributed between positions 9175 and 8714; only two are drawn here for figure simplicity; green arrows) and the poly(A) signal (vertical green bar), as described in Landry et al. (26), are indicated. HIV-1 open reading frames also are indicated, including that of the putative antisense protein (ASP). The lower portion of this panel indicates the density of tags (vertical axis) distributed along the HIV-1 vector genome (x axis) for both HIV-1 samples (HIV rep1 and HIV rep2) and mock infection samples (Mock rep1 and Mock rep2). The five major peaks are numbered at the bottom, displaying the number of tags at each peak as well as the proportion of these tags representing sense or antisense transcription. (B) Total RNA from mock-infected or HIV-based vector-infected cells was extracted using miRvana or Trizol at 22 and 24 h postexposure and subjected to Northern blot hybridization. Left panel, total RNA gel electrophoresis; right two panels, Northern blots using strand-specific oligonucleotide probes aligning with the corresponding peak of tags detected by SAGE-Seq. Probes were designed to anneal with sense transcripts (red probes; top) or antisense transcripts (green probes; bottom) with the nucleic acid sequence complementary to the identified peak tag sequence. The plasmid encoding the HIV vector genome digested with BglII and AflII was used as a positive control for hybridization (+).
Fig. 3.
Fig. 3.
Analysis of cellular transcripts in mock- and HIV-infected cells. Average tag density analysis in mock-infected (black lines) and HIV-1-infected (red lines) samples for total cellular transcripts (lines), repetitive elements (dashed lines), and HERV elements (dotted lines) is shown. Most cellular transcripts were detected with 1 to 1,000 tags (log 0 to 3; average, 2.9 log) across the complete transcriptome. Only a few transcripts were identified in larger numbers (e.g., above 10,000; log 4). A smaller number of tags was observed for the expressed repetitive elements (average, 2.3 log), including HERVs (average, 1.9 log). Statistical differences between mock infection and HIV-1 infection distributions were assessed by Wilcoxon test.

References

    1. Anders S., Huber W. 2010. Differential expression analysis for sequence count data. Nat. Precedings 2010:1–5 - PMC - PubMed
    1. Archer J., et al. 2009. Detection of low-frequency pretherapy chemokine (CXC motif) receptor 4 (CXCR4)-using HIV-1 with ultra-deep pyrosequencing. AIDS 23:1209–1218 - PMC - PubMed
    1. Arendt C. W., Littman D. R. 2001. HIV: master of the host cell. Genome Biol. 2:REVIEWS103 - PMC - PubMed
    1. Bansal A., et al. 2010. CD8 T cell response and evolutionary pressure to HIV-1 cryptic epitopes derived from antisense transcription. J. Exp. Med. 207:51–59 - PMC - PubMed
    1. Bayne E. H., White S. A., Allshire R. C. 2007. DegrAAAded into silence. Cell 129:651–653 - PubMed

Publication types

MeSH terms

LinkOut - more resources