. 2011 Apr 20;31(16):6028-40.
doi: 10.1523/JNEUROSCI.6069-10.2011.

Orexin gene transfer into zona incerta neurons suppresses muscle paralysis in narcoleptic mice

Affiliations

Orexin gene transfer into zona incerta neurons suppresses muscle paralysis in narcoleptic mice

Meng Liu et al. J Neurosci. .

Abstract

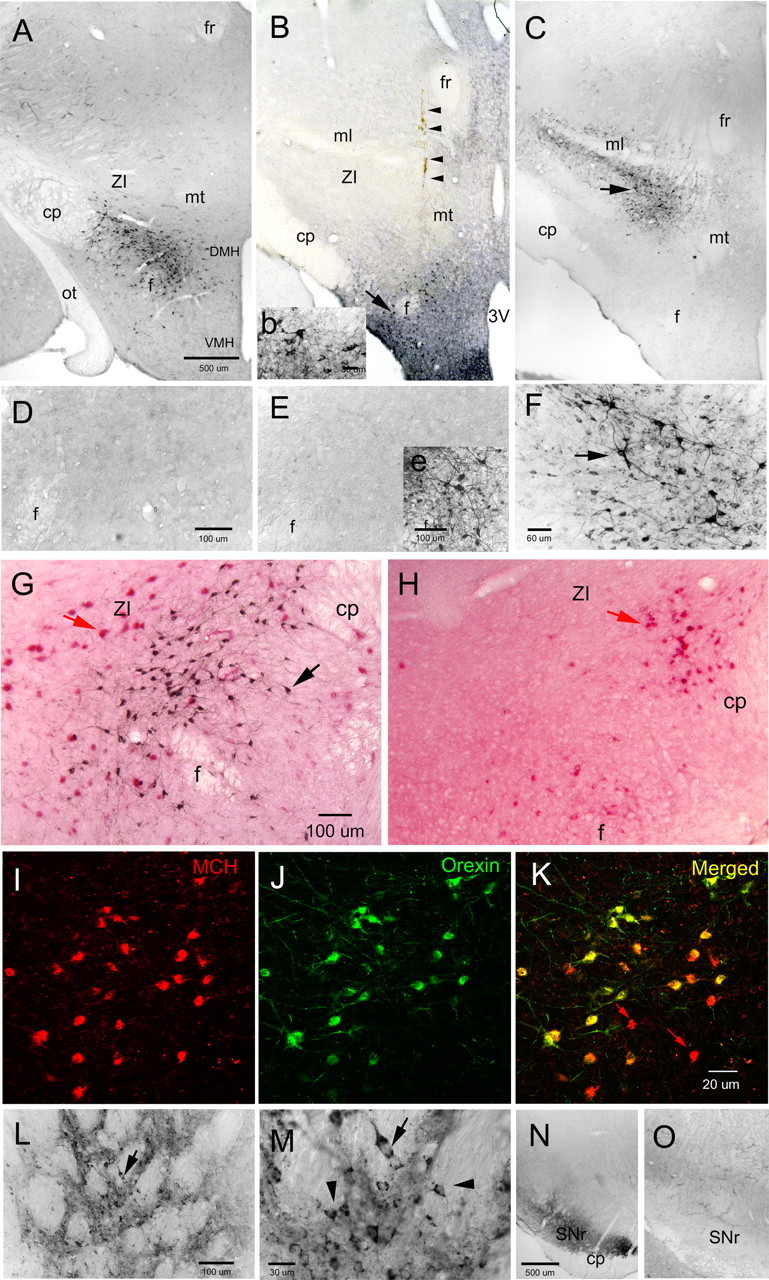
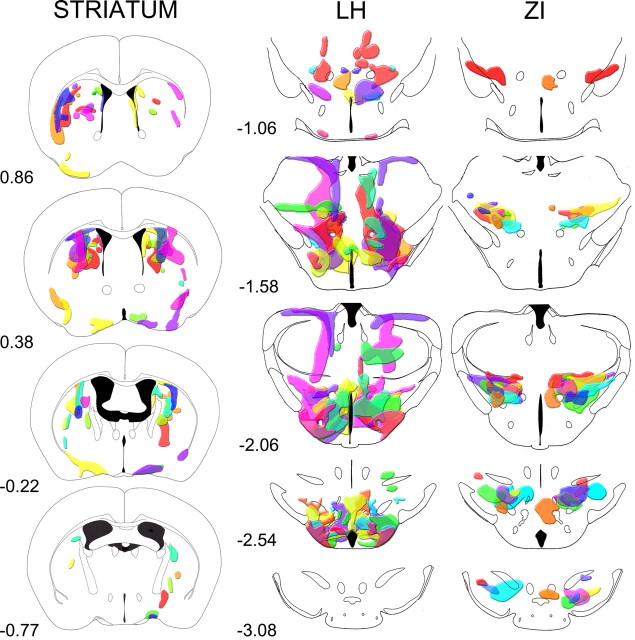
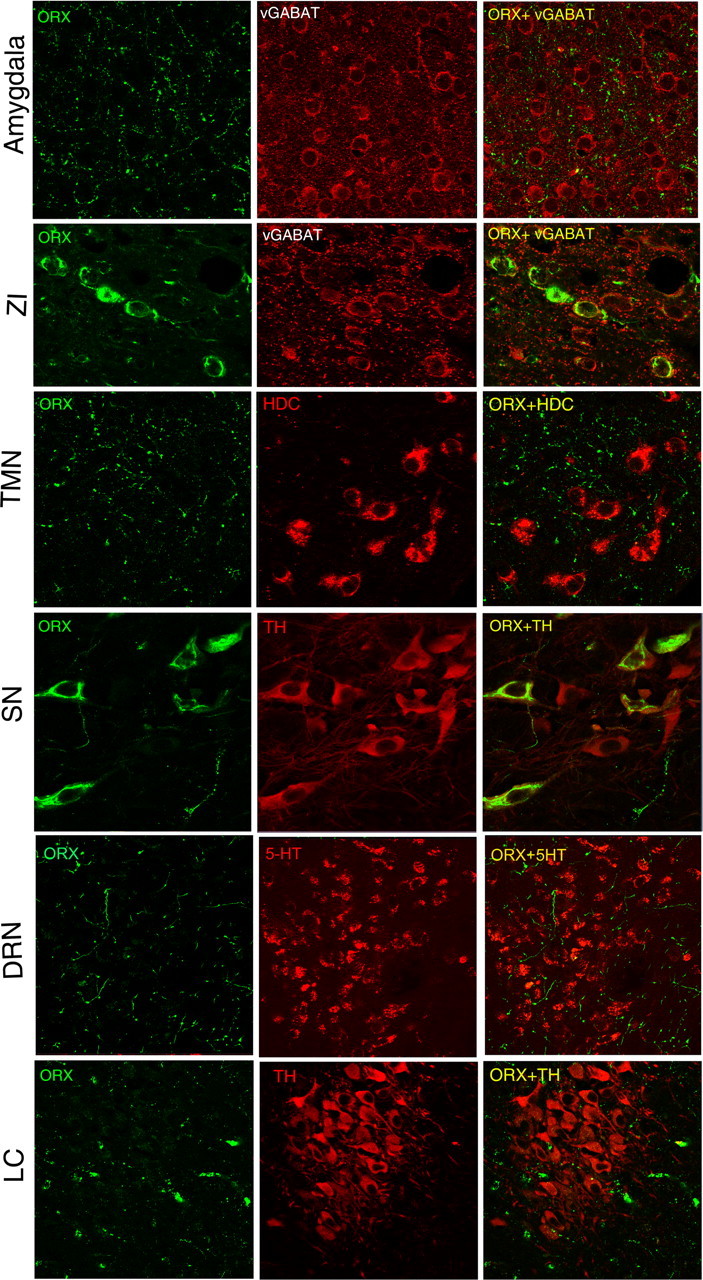
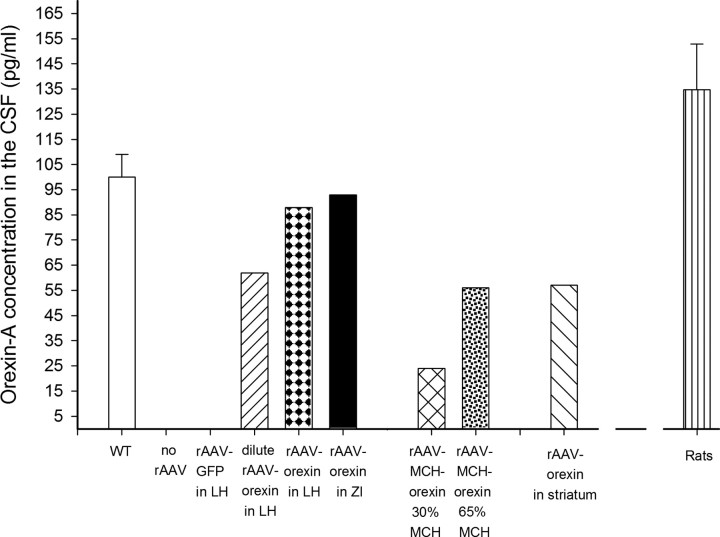
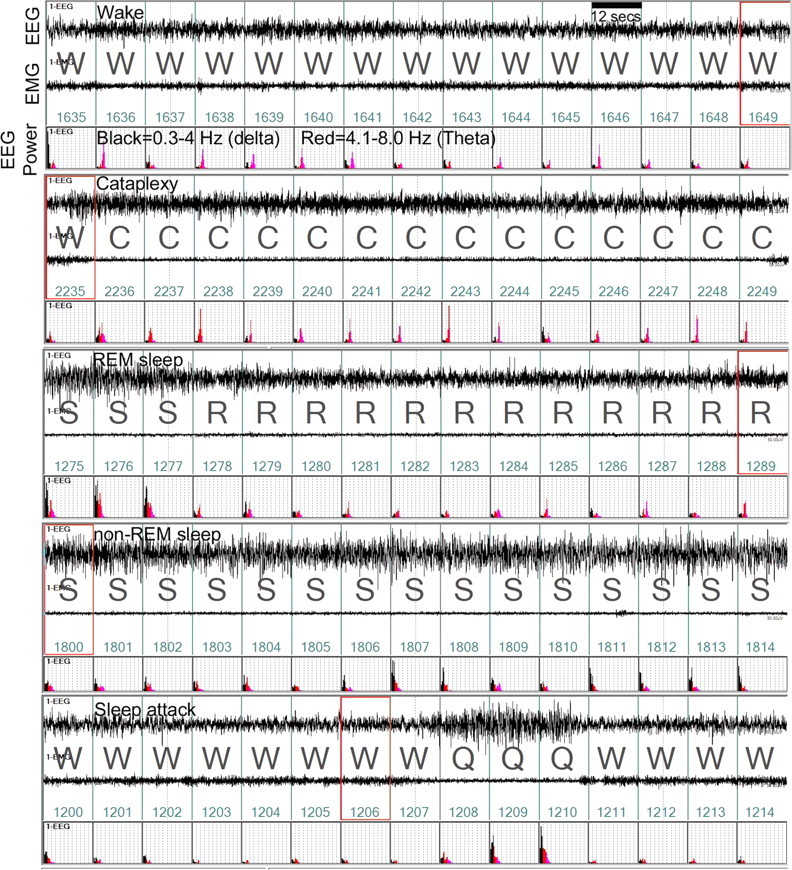
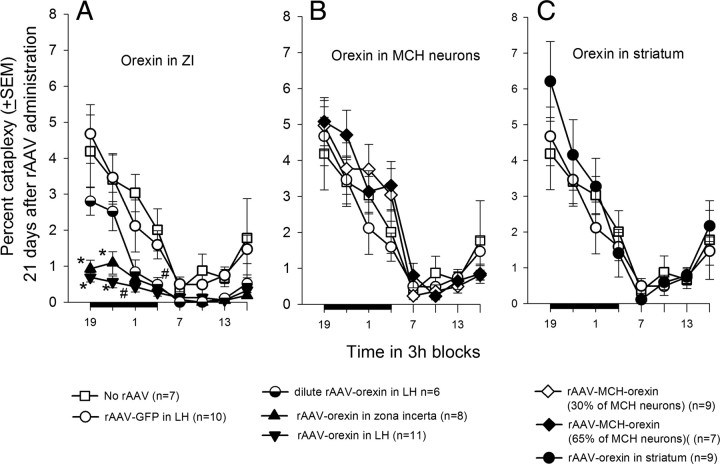
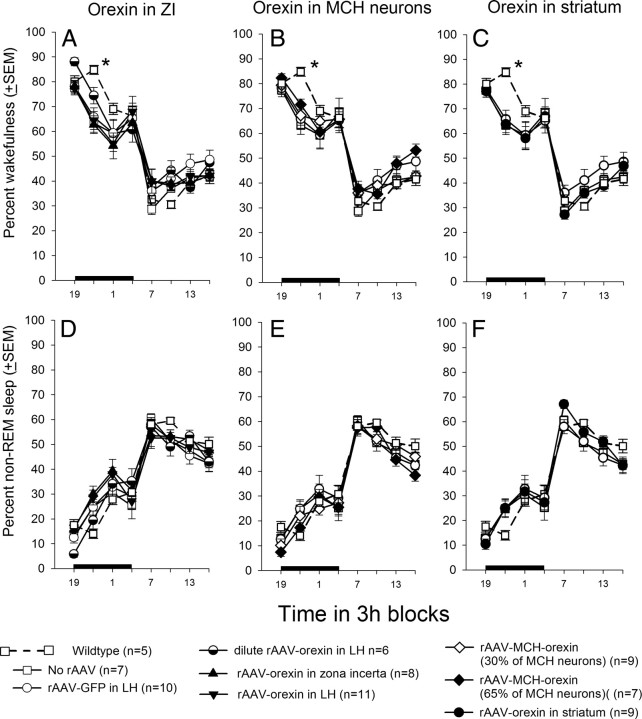
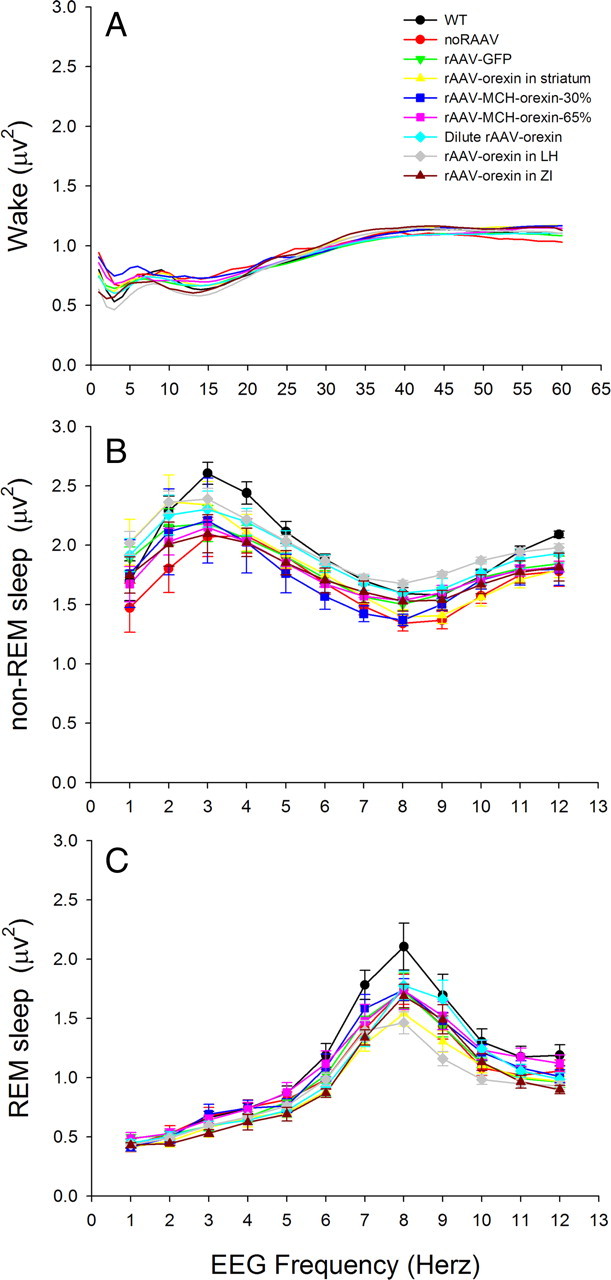
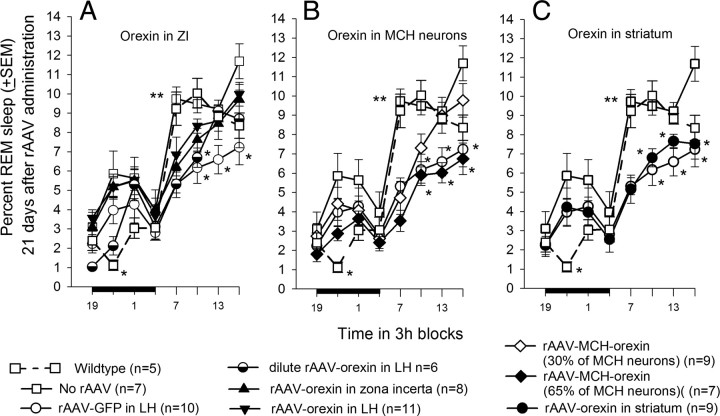
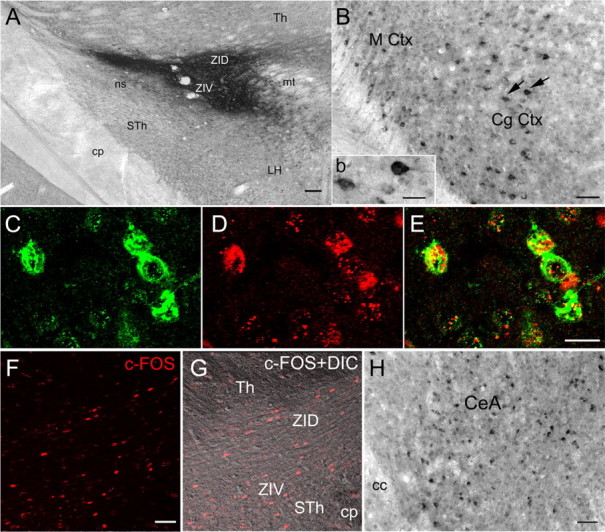
Cataplexy, a sudden unexpected muscle paralysis, is a debilitating symptom of the neurodegenerative sleep disorder, narcolepsy. During these attacks, the person is paralyzed, but fully conscious and aware of their surroundings. To identify potential neurons that might serve as surrogate orexin neurons to suppress such attacks, the gene for orexin (hypocretin), a peptide lost in most human narcoleptics, was delivered into the brains of the orexin-ataxin-3 transgenic mouse model of human narcolepsy. Three weeks after the recombinant adenoassociated virus (rAAV)-mediated orexin gene transfer, sleep-wake behavior was assessed. rAAV-orexin gene delivery into neurons of the zona incerta (ZI), or the lateral hypothalamus (LH) blocked cataplexy. Orexin gene transfer into the striatum or in the melanin-concentrating hormone neurons in the ZI or LH had no such effect, indicating site specificity. In transgenic mice lacking orexin neurons but given rAAV-orexin, detectable levels of orexin-A were evident in the CSF, indicating release of the peptide from the surrogate neurons. Retrograde tracer studies showed that the amygdala innervates the ZI consistent with evidence that strong emotions trigger cataplexy. In turn, the ZI projects to the locus ceruleus, indicating that the ZI is part of a circuit that stabilizes motor tone. Our results indicate that these neurons might also be recruited to block the muscle paralysis in narcolepsy.


Figures

Figure 1.
Figure 1.
Orexin-A-immunoreactive somata in wild-type C57BL/6J (A, G) and orexin-ataxin-3 transgenic mice. Photomicrographs represent coronal sections of areas of the mouse brain processed for visualization of orexin-A immunoreactivity. In WT mice, the orexin neurons are localized around the fornix in the posterior hypothalamus (A). A higher magnification view of the orexin neurons (black precipitate from the immunohistochemical process) in WT mice is shown in G. In the orexin-ataxin-3 mice, there was a selective degeneration (99.4%) of the orexin neurons because of the genetically targeted accumulation of the polyglutamine cytotoxicity in these neurons (H). However, other neurons including neurons containing melanin-concentrating hormone (red precipitate from alkaline phosphatase immunohistochemical process in G and H) are still present in the orexin-ataxin-3 mice (H) and could serve as surrogate neurons expressing orexin. In the present study, a rAAV vector transferred the gene for mouse prepro-orexin into specific brain regions in the orexin-ataxin-3 mouse. In the transgenic mice given no-rAAV (D) or given the control reporter gene green fluorescent protein (rAAV-GFP) (E), there were no orexin neurons present. In the latter group, GFP-immunoreactive neurons were evident at the injection site in the perifornical region indicating successful GFP gene transfer (inset e). In two groups of orexin-ataxin-3 mice, rAAV-orexin was delivered to the posterior hypothalamus and the two groups were formed based on the location of the neurons expressing orexin: a ventral group (B, inset b) in which the orexin neurons were diffusely present around the perifornical region and representative of the distribution of orexin neurons in WT mice (A), and a dorsal group (C) in which the orexin neurons are not located in WT mice but rAAV-orexin gene delivery produced the orexin-A-ir neurons in and around the zona incerta. In B, the arrow points to orexin neurons around the fornix (higher magnification is inset b), and the arrowheads indicate the injection needle tract. In C, the arrow identifies the orexin neurons clustered in the ZI. F represents higher magnification of neurons identified by the arrow in C. Since the MCH neurons are present in the orexin-ataxin-3 mice, two groups of orexin-ataxin-3 mice were given rAAV-MCH-orexin that expressed orexin under the control of the MCH promoter. I–K represent confocal laser-scanned images of the MCH neurons (I) that also contain orexin (J, K) in orexin-ataxin-3 mice. The virus did not infect all of the MCH neurons as some (identified by red arrows in K) MCH neurons did not express orexin. To further define specificity of the effect, in another group of transgenic mice, rAAV-orexin was delivered to the striatum (L). M is a higher magnification of neurons identified by arrow in L. In M, the arrowheads identify small neurons relative to the larger neuron (arrow) that express orexin. Orexin gene delivery to the striatum resulted in intense orexin fibers in the substantia nigra reticulata (N). In WT mice, such fibers are not present (O). The scale bar in A applies to B and C, the scale bar in D applies to E, the scale bar in G applies to H, the scale bar in K applies to I and J, and the scale bar in N applies to O. Abbreviations: 3V, Third ventricle; cp, cerebral peduncle; DMH, dorsomedial hypothalamus; f, fornix; fr, fasciculus retroflexus; ml, medial lemniscus; mt, mammillothalamic tract; ot, optic tract; SNr, substantia nigra reticulata; VMH, ventral medial hypothalamus; ZI, zona incerta.
Figure 2.
Figure 2.
Schematic representation of the distribution of orexin-A-ir neurons in the striatum, LH, and ZI groups. The drawings represent coronal sections of the brain regions where the orexin-A-ir neurons were present. Each color shows the distribution in one mouse, and independent mice were used in each group. The numbers below each schematic drawing represent the distance relative to bregma.
Figure 3.
Figure 3.
Orexin-A-ir varicosities in various brain regions after orexin gene transfer into the zona incerta. The first column of photomicrographs depicts orexin-A-ir fibers in various brain regions and orexin somata in the zona incerta and substantia nigra (SN). The second column identifies specific phenotypes of neurons and the third column depicts the merged image. In the ZI, the orexin gene is expressed in putative GABA neurons [identified by vesicular GABA transporter (vGABAT)] and in the tyrosine hydroxylase (TH) neurons of the substantia nigra (SN). Orexin-A-ir fibers are seen in limbic areas such as the amygdala, but also in arousal regions such as the TMN, DRN, and LC. Abbreviations: 5-HT, 5-Hydroxytryptamine; DRN, dorsal raphe nucleus; HDC, histidine decarboxylase; LC, locus ceruleus; ORX, orexin-A; SN, substantia nigra; TMN, tuberomammillary nucleus; TH, tyrosine hydroxylase; vGABAT, vesicular GABA transporter; ZI, zona incerta.
Figure 4.
Figure 4.
Levels of orexin-A in the CSF of mice and rats assessed by ELISA. Concentration of orexin-A (in picograms per milliliter) in the CSF of C57BL/6J mice and Sprague Dawley rats assessed by ELISA. The levels of orexin-A in WT C57BL/6J mice were assessed at the same circadian time points as in the orexin-ataxin-3 mice. The levels in the Sprague Dawley rats (n = 5) serve to verify the utility of the assay to detect orexin-A in the CSF. Orexin-ataxin-3 mice in the no-rAAV group or administered the control reporter gene (rAAV-GFP) had levels of orexin-A that were below detection limits. However, in the other groups, orexin-A levels approached levels in WT mice. The CSF was collected from the cisterna magna of mice and rats and stored at −80°C. A maximum of ∼10–15 μl of CSF could be acquired from each mouse. Therefore, CSF samples from five mice (ranks based on number of orexin-A-ir neurons) were pooled to yield the 50 μl required for the assay. WT mice represent average CSF from two separate groups. In rats, CSF from individual rats (n = 5) was used in the assay. Error bars indicate SEM.
Figure 5.
Figure 5.
Example of normal and abnormal sleep–wake states in a representative orexin-ataxin-3 mouse given no-rAAV. Each panel consists of a 3 min recording of the EEG, activity of the nuchal muscles (EMG), and power of the EEG in the delta (0.3–4 Hz; black) and theta bands (4–8 Hz; red) at night. The sleep–wake state is determined by the relationship of the EEG, EEG power, EMG activity, and simultaneous observation of the behavior via video recording. In the top panel, high EMG activity coupled with low-amplitude EEG, low delta power indicates that the mouse was awake (W). Cataplexy (second panel) is identified by an abrupt loss of EMG tone, postural collapse on video during an active waking, and an increase in theta activity (C). The third panel depicts a normal transition from non-REM to a REM sleep episode in the same mouse. The fourth and fifth panels depict episodes of non-REM sleep and sleep attack. Note that the sleep attack (Q) is brief and occurs while the mouse is engaged in purposeful behavior. It is different from cataplexy in that the mouse is usually upright and there is a mixture of delta/theta power in the EEG. Videotape recordings in all mice verified that the behavior coincided with EEG/EMG indices. Abbreviations: C, Cataplexy; S, non-REM sleep; R, rapid eye movement sleep; Q, sleep attack; W, wake. The numbers in green represent the serial epoch labels spanning 12 s each. The red boxes on epoch 1649, 2235, 1289, 1800, and 1206 are visual aids indicating the streaming video file.
Figure 6.
Figure 6.
Effects of orexin gene delivery on cataplexy. Three weeks after gene delivery, sleep and behavior were recorded for 48 h. Each data point represents a 3 h average (±SEM) and is summarized over a 24 h period. The dark bar on the ordinate represents the 12 h night (light-off) period. Cataplexy was determined on the basis of both EEG/EMG and video behavioral data. Cataplexy is prevalent during the night when it occupies as much time as REM sleep (Table 5). Significance tests represent one-way ANOVA followed by Dunnett's post hoc test (p < 0.05). *Versus no-rAAV and rAAV-GFP; #dilute rAAV-orexin, rAAV-orexin-LH, rAAV-orexin-ZI versus no-rAAV and rAAV-GFP.
Figure 7.
Figure 7.
Average percentage of wakefulness and non-REM sleep in orexin-ataxin-3 mice after rAAV gene transfer. A–F summarize the average (±SEM) percentage of wakefulness or non-REM sleep at 3 h intervals across the 24 h period. The data for WT mice are given for comparison. One-way ANOVA followed by Dunnett's post hoc test with WT as the control group, p < 0.05. The asterisk represents significant difference of the WT group compared with all groups except the dilute rAAV-orexin (half-filled circle) and rAAV-MCH-orexin 65% (filled diamond) groups.
Figure 8.
Figure 8.
Spectrum of frequencies of the EEG at night during wakefulness (A), non-REM sleep (B), and REM sleep (C) in WT and orexin-ataxin-3 mice given rAAV. EEG spectral analysis was performed using the fast Fourier transform method (SleepSign Software; Kissei Comtec) and the power (in square microvolts) at each 1.0 Hz bin was determined. Each sleep–wake state has a characteristic EEG frequency with faster (>20 Hz) frequencies occurring during waking and slower (1–4 Hz) frequencies during non-REM sleep. During REM sleep, the EEG oscillates between 6 and 12 Hz. Orexin gene transfer did not shift the frequency or change the EEG power compared with animals receiving no-rAAV. The data symbols or the SE bars are not depicted in A for purposes of clarity.
Figure 9.
Figure 9.
Average (±SEM) percentage of REM sleep over 24 h in WT and orexin-ataxin-3 mice. The data for WT mice are given for comparison. The bar graphs in A–C summarize the average (±SEM) percentage of REM sleep during the 12 h day and night periods. One-way ANOVA followed by Dunnett's post hoc test, p < 0.05. *Compared with no-rAAV group; **no-rAAV versus all groups except WT.
Figure 10.
Figure 10.
Inputs to the zona incerta from the cingulate cortex and the amygdala are c-Fos positive. The retrograde tracer CTb was injected into the zona incerta (A) (unilateral injection; 50 nl; 2% solution), and 7 d later the orexin-ataxin-3 mice were kept awake for 6 h and then killed (overdose of Nembutal). Neurons in the cingulate cortex (B; inset b) and the amygdala (H) were filled with the tracer, indicating that these neurons project to the zona incerta. Inset b depicts the neurons identified by arrows in B. Adjacent sections were processed for visualization of c-Fos, a marker of neuronal activity, and the retrogradely labeled neurons in the cingulate cortex were positive for CTb (C) and c-Fos (D), indicating that these neurons were active during waking. E is a merge of neurons depicted in C and D. The contralateral zona incerta contained numerous c-Fos-positive neurons, indicating that this region is also active during waking. F depicts c-Fos-immunoreactive neurons in the ZI, whereas G depicts the same section under differential contrast (DIC) to highlight the tissue section. Scale bars: A, 100 μm; B, 50 μm; inset b, 20 μm; (in E) C–E, 20 μm; (in F) F, G, 50 μm; H, 50 μm. Abbreviations: CeA, Central nucleus of the amygdala; cc, corpus callosum; CgCtx, cingulated cortex; cp, cerebral peduncle; DIC, differential interference contrast; Th, thalamus; LH, lateral hypothalamus; MCtx, motor cortex; mt, mammillothalamic tract; STH, subthalamus; ZID, zona incerta dorsal; ZIV, zona incerta ventral.

References

    1. Aldrich MS. The neurobiology of narcolepsy-cataplexy. Prog Neurobiol. 1993;41:533–541. - PubMed
    1. Bittencourt JC, Presse F, Arias C, Peto C, Vaughan J, Nahon JL, Vale W, Sawchenko PE. The melanin-concentrating hormone system of the rat brain: an immuno- and hybridization histochemical characterization. J Comp Neurol. 1992;319:218–245. - PubMed
    1. Blouin AM, Thannickal TC, Worley PF, Baraban JM, Reti IM, Siegel JM. Narp immunostaining of human hypocretin (orexin) neurons: loss in narcolepsy. Neurology. 2005;65:1189–1192. - PMC - PubMed
    1. Carter ME, Yizhar O, Chikahisa S, Nguyen H, Adamantidis A, Nishino S, Deisseroth K, de Lecea L. Tuning arousal with optogenetic modulation of locus coeruleus neurons. Nat Neurosci. 2010;13:1526–1533. - PMC - PubMed
    1. Chemelli RM, Willie JT, Sinton CM, Elmquist JK, Scammell T, Lee C, Richardson JA, Williams SC, Xiong Y, Kisanuki Y, Fitch TE, Nakazato M, Hammer RE, Saper CB, Yanagisawa M. Narcolepsy in orexin knockout mice: molecular genetics of sleep regulation. Cell. 1999;98:437–451. - PubMed

Publication types

MeSH terms