. 2011 Apr 20;31(16):6140-58.
doi: 10.1523/JNEUROSCI.6514-10.2011.

Genomewide analysis of rat barrel cortex reveals time- and layer-specific mRNA expression changes related to experience-dependent plasticity

Affiliations

Genomewide analysis of rat barrel cortex reveals time- and layer-specific mRNA expression changes related to experience-dependent plasticity

Astrid Vallès et al. J Neurosci. .

Abstract

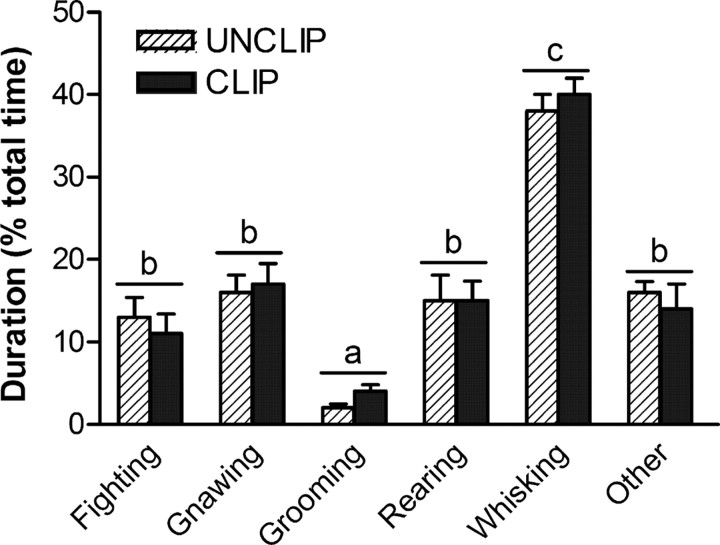
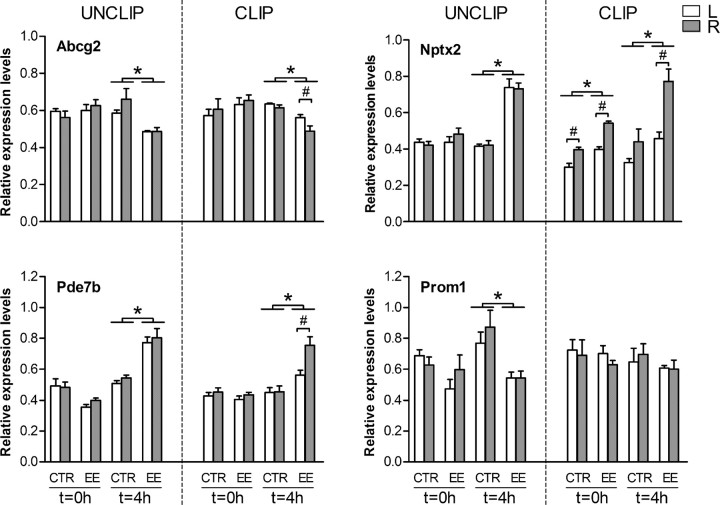
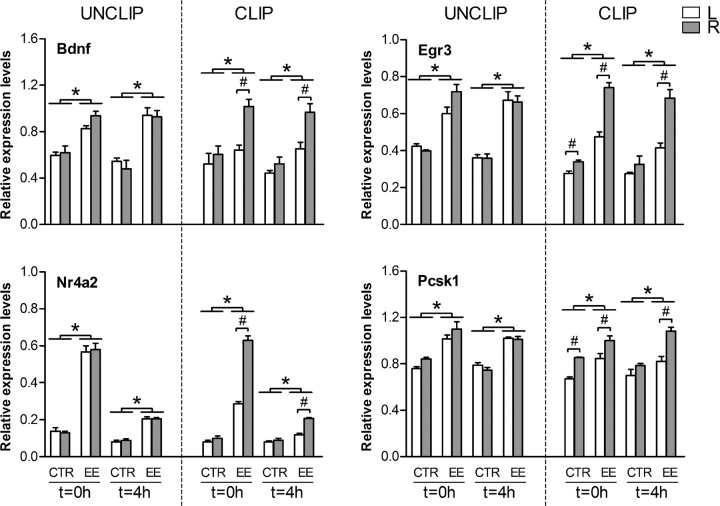
Because of its anatomical organization, the rodent whisker-to-barrel system is an ideal model to study experience-dependent plasticity. Manipulation of sensory input causes changes in the properties of the barrels at the physiological, structural, and functional levels. However, much less is known about the molecular events underlying these changes. To explore such molecular events, we have used a genomewide approach to identify key genes and molecular pathways involved in experience-induced plasticity in the barrel cortex of adult rats. Given the natural tendency of rats to explore novel objects, exposure to an enriched environment (EE) was used to stimulate the activity of the whisker-to-barrel cortex in vivo. Microarray analysis at two different time points after EE revealed differential expression of genes encoding transcription factors, including nuclear receptors, as well as of genes involved in the regulation of synaptic plasticity, cell differentiation, metabolism, and, surprisingly, blood vessel morphogenesis. These expression differences reflect changes in somatosensory information processing because unilateral whisker clipping showed EE-induced differential expression patterns in the spared versus deprived barrel cortex. Finally, in situ hybridization revealed cortical layer patterns specific for each selected gene. Together, the present study offers the first genomewide exploration of the key genes regulated by somatosensory stimulation in the barrel cortex and thus provides a solid experimental framework for future in-depth analysis of the mechanisms underlying experience-dependent plasticity.


Figures

Figure 1.
Figure 1.
Overview of the experimental design and methods of tissue dissection. A, General experimental design. The animals underwent a first habituation period for 7 d, followed by a second habituation period of 5 d. On day 11, the right whiskers of half of the rats were clipped (CLIP) under anesthesia; the other half received anesthesia only (UNCLIP). On day 12, the animals were exposed to the dark, with or without exposure to EE for 30 min (EE and CTR groups, respectively) and killed either immediately (t = 0 h) or 4 h (t = 4 h) after the end of the experiment. B, Enriched environment cage. The cage in which the rats were placed for a period of 30 min. Shown are the EE attributes (1–8) and the quadrants (Q1–Q4). The EE objects used were (1) different textures, (2) grated plastic box, (3) curled paper, (4) foam pipes, (5) plastic pipes, (6) wooden brush, (7) plastic balls, and (8) plastic wire strainer. Care was taken to place these objects always in the same place at the beginning of the EE session. C, Dissection area. The barrel cortex was dissected, separately for left and right hemispheres, using a 2 mm micropunch. Shown is the remaining tissue after micropunch, overlaid to its corresponding stereotactic picture (Paxinos and Watson, 1998) showing that the area was always located in S1 and spanned layers 1–6.
Figure 2.
Figure 2.
Representative brain areas activated by enrichment. A, Shown are representative images of Fos mRNA obtained by in situ hybridization in CTR and EE animals at t = 0 h. In CTR animals, Fos levels were barely detectable, whereas in EE animals, increased levels were observed in striatum, barrel cortex, hippocampus, and cerebellum. Magnifications are shown at the bottom left corner on each image. B, Expression levels of the eight genes (Arc, Btg2, Ch25h, Cyr61, Egr3, Fos, Nptx2, and Nr4a2) selected for in situ hybridization were quantified in CLIP animals in the four above-mentioned brain areas, showing different regional and temporal patterns of expression under CTR and EE conditions.
Figure 3.
Figure 3.
Layer-specific differential gene expression in rat barrel cortex after EE. A, Representative images of in situ hybridization analysis of Arc, Btg2, Nr4a2, and Nptx2 mRNA in UNCLIP groups: CTR and EE animals at t = 0 h (Arc, Btg2, Nr4a2) or t = 4 h (Nptx2); cortical layers are indicated on each image (magnification, 5×). B, Quantification of Arc, Btg2, Nr4a2, Nptx2, Ch25h, Cyr61, Egr3, and Fos expression levels (in situ hybridization) in different cortical layers of UNCLIP animals, under CTR, EE t = 0 h, and EE t = 4 h conditions.
Figure 4.
Figure 4.
Behavioral analysis of UNCLIP and CLIP animals during exposure to EE. Shown is the amount of time that the animals displayed a certain behavior (namely, fighting, gnawing, grooming, rearing, whisking, and other behaviors). The measurements were performed during a period of 10 min, starting 10 min after the beginning of the EE exposure, in both UNCLIP and CLIP animals (white and gray bars, respectively). Bars represent average ± SEM (n = 6–8). Homogeneous subsets are indicated with the same characters (a–c) above the bars (two-way ANOVA, p ≤ 0.001; post hoc SNK test).
Figure 5.
Figure 5.
qPCR analysis of gene expression in the rat barrel cortex after EE. Normalized expression values of Arc, Apold1, Btg2, Ch25h, Chrm4, Cyr61, Dusp1, Fos, FosB, and Plat mRNA at t = 0 h and t = 4 h after exposure to EE for 30 min, in UNCLIP (right group of bars) and CLIP (left group of bars) animals. For normalization, CycA and Ywhaz were selected as housekeeping genes. Measurements were made separately for left (L, white bars) and right (R, gray bars) barrel cortices. Note that, in CLIP groups, L barrel cortex is deprived of sensory input attributable to unilateral clipping of the right whiskers. Bars represent average normalized expression values ± SEM. * represents significant differences between CTR and EE groups (two-way ANOVA, p ≤ 0.05; post hoc SNK test). # represents significant differences between L and R barrel cortices within the same group and time point (p ≤ 0.05, Student's t test). In the deprived (L) barrel cortex of CLIP animals, for all analyzed genes, expression levels were significantly higher in EE than in CTR groups at t = 0 h, indicative of residual activation in the deprived cortex (p ≤ 0.05, Student's t test); for the sake of clarity, these significant differences have not been marked by a symbol in the figure.
Figure 6.
Figure 6.
qPCR analysis of gene expression in the rat barrel cortex after EE. Normalized expression values of Abcg2, Nptx2, Pde7b, and Prom1 mRNA in rat somatosensory cortex at t = 0 h and t = 4 h after exposure to EE for 30 min, in UNCLIP (right group of bars) and CLIP (left group of bars) animals. For normalization, CycA and Ywhaz were selected as housekeeping genes. Measurements were made separately for left (L, white bars) and right (R, gray bars) barrel cortices. Note that, in CLIP groups, L barrel cortex is deprived of sensory input attributable to unilateral clipping of the right whiskers. Bars represent average normalized expression values ± SEM. * represents significant differences between CTR and EE groups (two-way ANOVA, p ≤ 0.05; post hoc SNK test). # represents significant differences between left and right barrel cortices within the same group and time point (p ≤ 0.05, Student's t test). In the deprived (L) barrel cortex of CLIP animals, for all analyzed genes, expression levels were significantly higher in EE than in CTR groups at t = 4 h, except for Prom1, indicative of residual activation in the deprived cortex (p ≤ 0.05, Student's t test); for the sake of clarity, these significant differences have not been marked by a symbol in the figure.
Figure 7.
Figure 7.
qPCR analysis of gene expression in the rat barrel cortex after EE. Normalized expression values of Bdnf, Egr3, Nr4a2, and Pcsk1 mRNA in rat somatosensory cortex at t = 0 h and t = 4 h after exposure to EE for 30 min, in UNCLIP (right group of bars) and CLIP (left group of bars) animals. For normalization, CycA and Ywhaz were selected as housekeeping genes. Measurements were made separately for left (L, white bars) and right (R, gray bars) barrel cortices. Note that, in CLIP groups, L barrel cortex is deprived of sensory input attributable to unilateral clipping of the right whiskers. Bars represent average normalized expression values ± SEM. * represents significant differences between CTR and EE groups (two-way ANOVA, p ≤ 0.05; post hoc SNK test). # represents significant differences between left and right barrel cortices within the same group and time point (p ≤ 0.05, Student's t test). In the deprived (L) barrel cortex of CLIP animals, for all analyzed genes, expression levels were significantly higher in EE than in CTR groups at t = 0 h and t = 4 h, except for Bdnf at t = 0 h and Pcsk1 at t = 4 h, indicative of some activation in the deprived cortex (p ≤ 0.05, Student's t test); for the sake of clarity, these significant differences have not been marked by a symbol in the figure.
Figure 8.
Figure 8.
Specificity index showing the right/left ratio of activation in the two hemispheres of UNCLIP and CLIP groups. A specificity index was calculated, based on qPCR data, to explore the degree of activation of the genes selected for qPCR validation in right (R) versus left (L) barrel cortices (for details, see Materials and Methods). In CLIP animals, if the index is higher than 1, activation is higher in spared (R) than in deprived (L) cortex. In UNCLIP animals, the specificity index quantifies hemispheric differences in the absence of clipping. Shown are the results of this index for genes specifically regulated after EE at t = 0 h (A), t = 4 h (B), or both time points (C) (bottom). Bars represent average specificity index values ± SEM. * represents values significantly higher than 1 (one-sample t test, reference value 1, p ≤ 0.05). # represents significant differences between UNCLIP and CLIP groups (p ≤ 0.05, Student's t test). Marginally significant differences are indicated by & symbol (0.05 < p ≤ 0.1).
Figure 9.
Figure 9.
EE-induced layer-specific differential gene expression in the rat barrel cortex of CLIP groups. In situ hybridization analysis showing expression levels of selected genes in the barrel cortex, namely Arc, Btg2, Ch25h, Cyr61, Egr3, Fos, Nptx2, and Nr4a2. Expression levels were evaluated in CLIP animals, under CTR, EE t = 0 h, and EE t = 4 h conditions. The analysis was performed separately for left (L, deprived) and right (R, spared) barrel cortices. Note that the expression levels in the R barrel cortex were similar as in UNCLIP animals and that L barrel cortex only displayed residual activation.

Similar articles

Cited by

References

    1. Ahissar E, Sosnik R, Haidarliu S. Transformation from temporal to rate coding in a somatosensory thalamocortical pathway. Nature. 2000;406:302–306. - PubMed
    1. Albrecht C, von Der Kammer H, Mayhaus M, Klaudiny J, Schweizer M, Nitsch RM. Muscarinic acetylcholine receptors induce the expression of the immediate early growth regulatory gene CYR61. J Biol Chem. 2000;275:28929–28936. - PubMed
    1. Aronoff R, Petersen CC. Layer, column and cell-type specific genetic manipulation in mouse barrel cortex. Front Neurosci. 2008;2:64–71. - PMC - PubMed
    1. Barth AL, McKenna M, Glazewski S, Hill P, Impey S, Storm D, Fox K. Upregulation of cAMP response element-mediated gene expression during experience-dependent plasticity in adult neocortex. J Neurosci. 2000;20:4206–4216. - PMC - PubMed
    1. Bisler S, Schleicher A, Gass P, Stehle JH, Zilles K, Staiger JF. Expression of c-Fos, ICER, Krox-24 and JunB in the whisker-to-barrel pathway of rats: time course of induction upon whisker stimulation by tactile exploration of an enriched environment. J Chem Neuroanat. 2002;23:187–198. - PubMed

Publication types

LinkOut - more resources