. 2011 Dec;21(12):2681-95.
doi: 10.1093/cercor/bhr040. Epub 2011 Apr 20.

The local field potential reflects surplus spike synchrony

Affiliations

The local field potential reflects surplus spike synchrony

Michael Denker et al. Cereb Cortex. 2011 Dec.

Abstract

While oscillations of the local field potential (LFP) are commonly attributed to the synchronization of neuronal firing rate on the same time scale, their relationship to coincident spiking in the millisecond range is unknown. Here, we present experimental evidence to reconcile the notions of synchrony at the level of spiking and at the mesoscopic scale. We demonstrate that only in time intervals of significant spike synchrony that cannot be explained on the basis of firing rates, coincident spikes are better phase locked to the LFP than predicted by the locking of the individual spikes. This effect is enhanced in periods of large LFP amplitudes. A quantitative model explains the LFP dynamics by the orchestrated spiking activity in neuronal groups that contribute the observed surplus synchrony. From the correlation analysis, we infer that neurons participate in different constellations but contribute only a fraction of their spikes to temporally precise spike configurations. This finding provides direct evidence for the hypothesized relation that precise spike synchrony constitutes a major temporally and spatially organized component of the LFP.


Figures

Figure 1.
Figure 1.
Schematic illustration of the analysis framework. Spikes of 2 neurons (A and B, yellow background) and an LFP are recorded in 2 trials from 3 separate electrodes (right) spaced at approximately 400 μm. In addition, spikes from 2 unobserved neurons are depicted. The spikes of one recorded neuron are classified as CC (cyan) or UE (red) if they are precisely (±3 ms) synchronized with a spike of the second neuron recorded in parallel, and otherwise as isolated (ISO, gray). In contrast to CCs, UEs identify coincidences in epochs where the high number of observed coincidences across trials (top left) significantly exceeds the prediction based on the firing rates. This study investigates the relationship of these 2 types of observed spike synchrony (CC and UE) to the LFP population signal as a mesoscopic monitor of brain processing. In UE epochs, synchrony between both neurons in excess of the chance contribution is commonly explained by their specific reliable and temporally confined coactivation in a neuronal ensemble, termed assembly. Two assembly activations are sketched in blue and green (colored spikes and background). Only one neuron (B) of the assembly shown in blue is observed; neuron A participates only in the assembly shown in green. Hence, only the assembly shown in green can be detected as a UE by the elevated coincidence count between A and B, yet also ISO and CC spikes may be part of an assembly hidden from the observer. Asterisk: see main text.
Figure 2.
Figure 2.
Characteristics of LFP and spiking dynamics. (A) Two single-trial LFPs recorded simultaneously (gray) at different electrodes (during long trials with movement to the right in the SELF task). Superimposed are the beta-filtered (10–22 Hz) signals (black) and their instantaneous oscillation phase (indicated by small black lines above). The histogram visualizes the phase differences between the 2 signals across all time bins. (B) Spike raster of all trials (sorted by reaction time after the delay period) of one example neuron recorded in the same session as the LFPs shown above. (C–E) Corresponding interspike interval distribution (C), the normalized autocorrelogram (D), and the cross-correlogram (E) with a different neuron recorded in parallel (neuron 1 in Supplementary Fig. S1). Gray curves in D and E indicate the mean (solid) and 5% confidence intervals (dashed) of the autocorrelogram and cross-correlogram obtained from 1000 surrogate spike trains where each spike was dithered uniformly in a window of ±10 ms around its original position. The structure of the autocorrelation and cross-correlation is explained by the nonstationarity of the firing rate. The center bin is removed in (D); bin size in all panels: 1 ms.
Figure 3.
Figure 3.
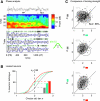
The magnitude of the STA depends on the occurrence of synchronized spiking activity. (A) STA of the LFP averaged over all 123 neurons (n = 297 484 spikes total) for the 3 disjunct sets of spikes. The left panel compares STAs of ISO (dark gray curve, n = 240 455) with CC (cyan curve, n = 44 867). To account for the difference in variability due to sample sizes, the STA of ISO is repeatedly recomputed using only 44 867 random trigger spikes. The light gray band encloses at each point in time 95% of all recomputed STAs. The middle and right panel compare STAs of UE (red curve, n = 12 162) with ISO and CC, respectively. (B) Percentage of neurons per animal (vertical) where the STA obtained from one spike set exceeds (in area) the STA of another set (horizontal axis: the 3 comparisons of sets corresponding to the 3 graphs in A are represented by the color codes). Wide, light bars: For each neuron the STA of one set qualifies as larger than the other if it exceeds ρ = 50% of its 1000 sample size corrected recomputations (performed as in A). Superimposed narrow dark bars: more strict criterion ρ = 95% (i.e., at α = 5%). (C) Same comparisons as in B, however, now the 4 bars of each comparison distinguish STAs obtained for neurons with the same number Np of partner neurons tested for pairwise coincidences (ρ = 50%; pooled across both animals). (D) The correlation of LFP amplitude and spike rate (200 ms windows, 100 ms overlap) is not significant (α = 0.05, coefficient R). (E) Bottom: LFP-triggered histogram of ISO (left), CC (middle), and UE (right) averaged across the population (expressed as the probability of spike occurrence). The trigger times are all local LFP maxima, which are separated by a minimum time difference of 33 ms (i.e., allowing trigger frequencies of up to 30 Hz to single out the beta component). Each neuron is related to exactly one LFP signal. Top: LFP averages based on the same triggers shown for each neuron (light gray curves). The dark gray curve is the average of the single-neuron LFP averages.
Figure 4.
Figure 4.
LFP-spike phase coupling reveals locking increase for coincidences. (A) Determination of phase and amplitude (example neuron). Top: single recorded LFP trial; middle: trial-averaged power spectrogram. The beta activity during the PP (between PS and AT) disappears with movement (Mvt). Bottom: For analysis, phase (green) and amplitude (blue) of the beta-filtered LFP (upper trial is shown in the top graph) is extracted at the spike times (ticks). Resulting phase distributions (green) are characterized by their circular standard deviation σ. Same neuron as in Figure 2. (B) Percentage of neurons with a circular standard deviation of the ISO (gray curve), CC (cyan), and UE (red) phase distribution below σ (horizontal axis). For the average σl = 1.98 of the set of significantly locked neurons (all spikes, α = 0.05), the percentages are also shown as bars. (C) Comparisons of the circular standard deviations σ of the 3 sets for individual neurons: ISO versus CC (top, n = 291), ISO versus UE (middle, n = 142), and CC versus UE (bottom, n = 136). Each dot represents one neuron in one experimental configuration. The percentages show the fraction of data points above the diagonal. The light (dark) gray filled ellipse covers 2 (1) standard deviation(s) of the sample variance (outlined ellipse: predictor ΨISI, surrogate data ISO vs. CC with shuffled ISIs).
Figure 5.
Figure 5.
Distributions of LFP phase and amplitude extracted at the spike times of a single neuron. Same neuron as in Figures 2 and 4. All distributions are normalized to unit area and are shown separately for ISO (left), CC (middle), and UE (right). (A) The modulation of the 3 phase distributions increases from left to right. Phase π is the location of the trough of the LFP oscillation. The black curve in the middle and the right graph is the predictor based on the individual phase distributions of the contributing neurons (ΨPHASE). (B) LFP amplitudes are expressed as z-score.
Figure 6.
Figure 6.
Relation of spike synchrony to the interplay of phase and amplitude. (A) Joint histograms of the phase and amplitude for ISO (left), CC (middle), and UE (right) pooled across the population (25 × 25 bins; color bars indicate counts; phase π indicates LFP troughs). The top and left projections display the phase and amplitude distributions, respectively. The top middle and top right graphs compare the phase distribution with the distribution shown in the graph to the left: The shaded areas enclose at each phase 95% of 1000 phase distributions randomly chosen from the set to the left with the same number of spikes as in the current set. Black curves are the predictions based on the phase distributions of the individual neurons (ΨPHASE). The histograms include the neurons which have a minimal spike count (total of 25 spikes and a mean rate of 5 Hz per trial) and for which the phase distribution of all spikes is significantly locked (α = 0.05). (B) Phase distributions of the 3 sets, considering only the 50% of the spikes at highest LFP amplitudes (Hi spikes, θ = 50%, above dashed black lines in A).
Figure 7.
Figure 7.
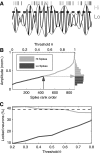
Influence of oscillation magnitude on locking of spikes to LFP. (A) Spikes in periods with an LFP amplitude (i.e., envelope of LFP, light gray curve) above a certain threshold (dashed line) are termed the “Hi” set (light gray ticks) and the remainder the “Lo” set (dark gray ticks). (B) Separation of spikes into Hi and Lo for the same example neuron as in Figures 2, 4, and 5. Spikes are rank ordered according to LFP amplitude; the histogram on the right shows the distribution of the respective amplitudes (normalized to maximum). The threshold θ is defined as the fraction of spikes labeled as Lo. The dark gray arrow illustrates a threshold choice of θ = 0.5 and corresponds to a relative amplitude specific to each neuron (light gray arrow). Spikes at extremely low LFP amplitudes (lowest 10%) do not enter the analysis. (C) Percentage of neurons with significant (Rayleigh test, α = 0.05) phase locking of their Hi spikes (light gray curve) and of their Lo spikes (dark gray curve) as a function of the amplitude threshold θ. Even for large θ (0.8), the set of Hi spikes shows significant locking in 36% of the neurons, although it contains only few spikes. The dashed line shows as a reference the percentage (39%) of locked neurons computed if spikes are not separated into Hi and Lo (i.e., all spikes).
Figure 8.
Figure 8.
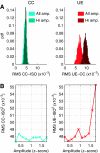
Phase locking of UEs is more strongly affected by amplitude than that of CCs. (A) Left graph: RMS differences between the CC and the ISO phase-locking distributions (25 bins) calculated for 1000 random resamples with a fixed sample size to ensure identical variability (light cyan). The distribution shown in dark cyan shows the 1000 RMS values exclusively considering spikes resampled from the Hi set. Right graph: Comparison of UE and CC phase distributions (fewer spikes are used for resampling as compared with the left graph). (B) Left graph: Mean RMS between the CC and the squared ISO distributions (ISO2, approximate predictor ΨPHASE, see Materials and Methods) as a function of LFP amplitude (z-score). Each data point is the mean RMS obtained from 1000 comparisons of resampled ISO and CC phase distributions with a fixed sample size n = 69. Right graph: Comparison of the UE and ISO2 phase distributions (same n as in the left graph). All graphs consider the same selection of neuron pairs as in Figure 6.
Figure 9.
Figure 9.
Conceptual model relating increased LFP locking and assemblies. (A) Sketch of the LFP (top) and the simultaneous spiking activity of 5 neurons (middle), of which only 2 are recorded (yellow background). Based on the latter, time periods are distinguished where coincidences occur at chance level (non-UE, left) from those with excess synchrony (UE, right). Each spike is either part of an assembly of coactive neurons (green) or not (black). In this simplified scenario, one assembly is active during non-UE, and a different one during UE; both observed neurons contribute to the latter. Assembly spikes are assumed to exhibit locking to the LFP, expressed by a nonuniform phase distribution p(ϕ) (green), in contrast to the unlocked nonassembly spikes (black). (B) Two factors β and γ determine the composition of the phase distributions (left) for ISO, CC, and UE of assembly and nonassembly spikes. γ determines the overall probability that a spike is part of an assembly activation (top, pISO(ϕ)). pCC(ϕ) (middle) results from the combinatorics of spikes drawn independently from pISO(ϕ). pUE(ϕ) (bottom) differs from pCC(ϕ) by the relative excess β of assembly spikes in UE periods. An estimate of β is obtained as a function of p2(ϕ) by substituting pUE(ϕ) and pCC(ϕ) in the bottom equation by the experimental distributions. γ is determined from either of the top 2 equations by using p(ϕ).

Similar articles

Cited by

References

    1. Aertsen AM, Gerstein GL, Habib MK, Palm G. Dynamics of neuronal firing correlation: modulation of “effective connectivity. J Neurophysiol. 1989;61:900–917. - PubMed
    1. Baker SN, Olivier E, Lemon RN. Coherent oscillations in monkey motor cortex and hand muscle EMG show task-dependent modulation. J Physiol. 1997;501:225–241. - PMC - PubMed
    1. Berens P, Keliris GA, Ecker AS, Logothetis NK, Tolias AS. Feature selectivity of the gamma-band of the local field potential in primate primary visual cortex. Front Neurosci. 2008;2:199–207. - PMC - PubMed
    1. Boashash B. Estimating and interpreting the instantaneous frequency of a signal. I. Fundamentals. Proc IEEE. 1992;80:520–538.
    1. Brown EN, Kass RE, Mitra PP. Multiple neural spike train data analysis: state-of-the-art and future challenges. Nat Neurosci. 2004;7:456–461. - PubMed

Publication types