. 2011 Jun 15;22(12):1960-70.
doi: 10.1091/mbc.E11-01-0053. Epub 2011 Apr 20.

Interleukin-15 regulates proliferation and self-renewal of adult neural stem cells

Affiliations

Interleukin-15 regulates proliferation and self-renewal of adult neural stem cells

Diego Gómez-Nicola et al. Mol Biol Cell. .

Abstract

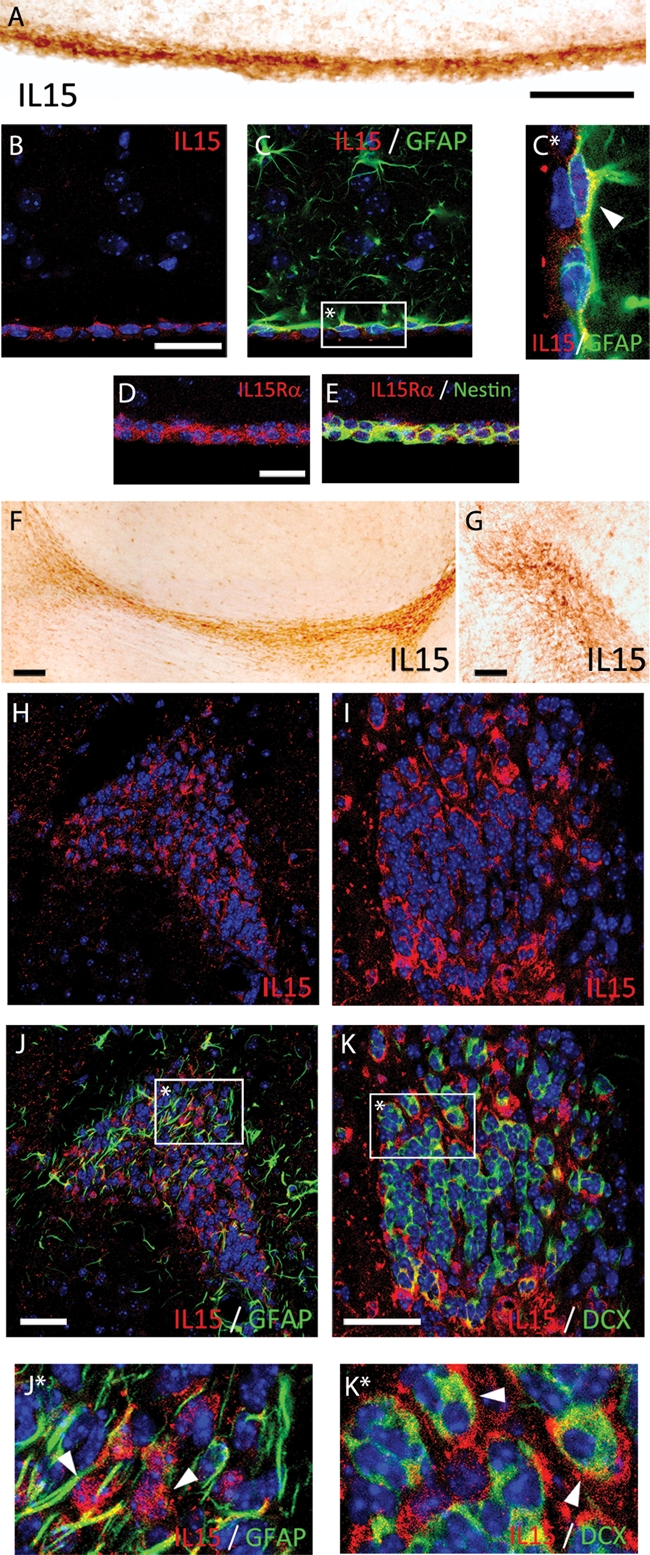
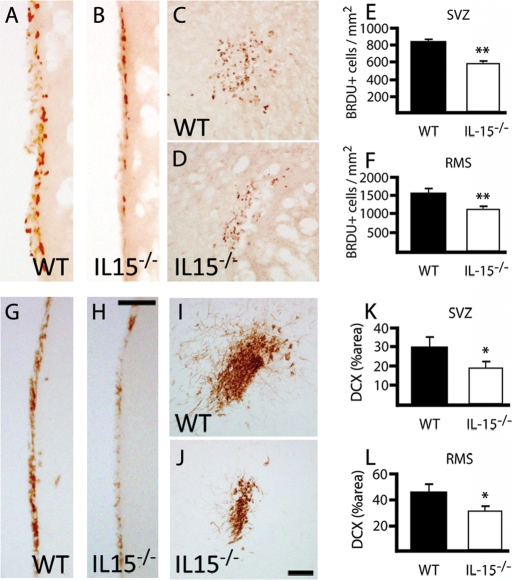
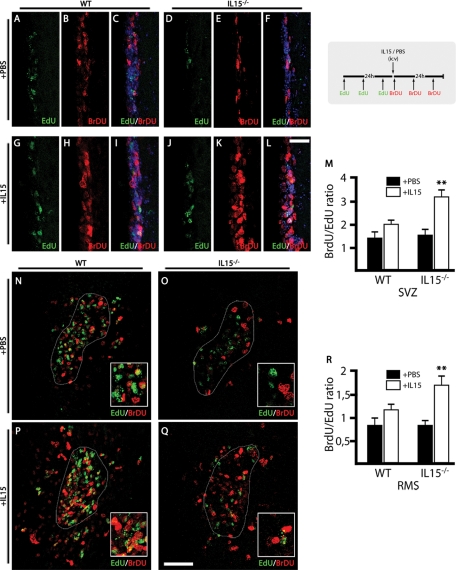
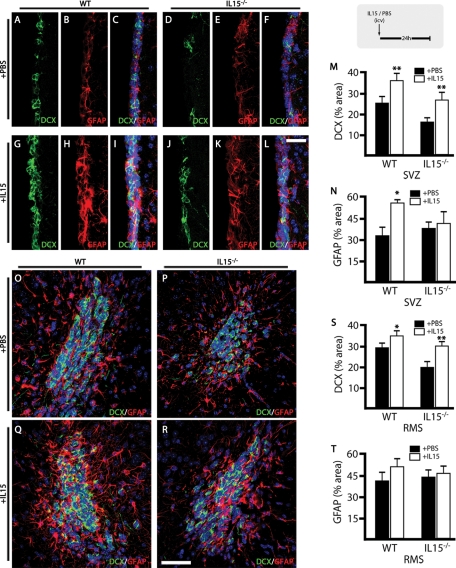
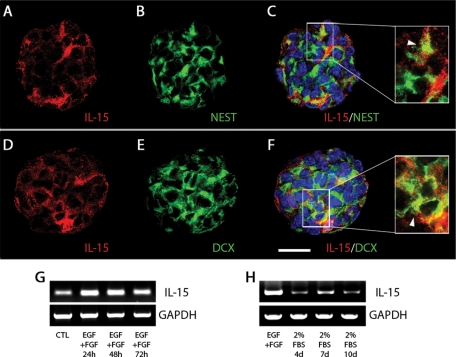
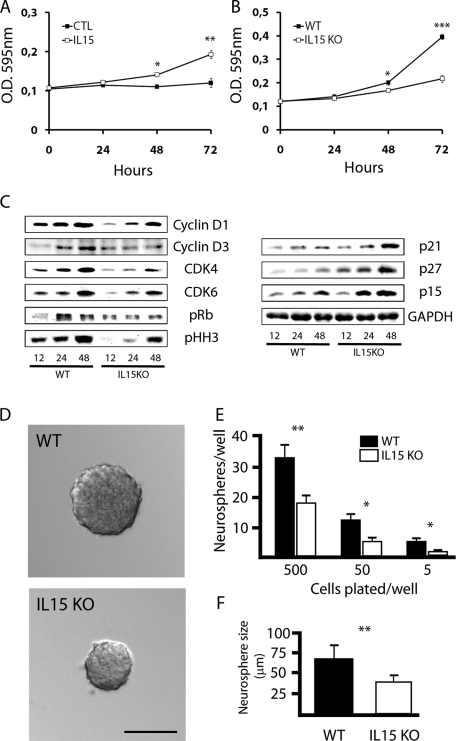
The impact of inflammation is crucial for the regulation of the biology of neural stem cells (NSCs). Interleukin-15 (IL-15) appears as a likely candidate for regulating neurogenesis, based on its well-known mitogenic properties. We show here that NSCs of the subventricular zone (SVZ) express IL-15, which regulates NSC proliferation, as evidenced by the study of IL-15-/- mice and the effects of acute IL-15 administration, coupled to 5-bromo-2'-deoxyuridine/5-ethynyl-2'-deoxyuridine dual-pulse labeling. Moreover, IL-15 regulates NSC differentiation, its deficiency leading to an impaired generation of neuroblasts in the SVZ-rostral migratory stream axis, recoverable through the action of exogenous IL-15. IL-15 expressed in cultured NSCs is linked to self-renewal, proliferation, and differentiation. IL-15-/- NSCs presented deficient proliferation and self-renewal, as evidenced in proliferation and colony-forming assays and the analysis of cell cycle-regulatory proteins. Moreover, IL-15-deficient NSCs were more prone to differentiate than wild-type NSCs, not affecting the cell population balance. Lack of IL-15 led to a defective activation of the JAK/STAT and ERK pathways, key for the regulation of proliferation and differentiation of NSCs. The results show that IL-15 is a key regulator of neurogenesis in the adult and is essential to understanding diseases with an inflammatory component.


Figures

FIGURE 1:
FIGURE 1:
IL-15 expression in the SVZ and RMS. (A, F–G) Immunostaining of IL-15+ cells in the SVZ (A) and the RMS (F, sagittal; G; coronal). (B, C) Double immunofluorescence for IL-15 (red; B, C) and GFAP (green; C) in the SVZ. (C*) Inset: magnification of IL-15 colocalization in GFAP+ cells (white arrowhead). (D, E) Double immunofluorescence for IL-15Rα (red; D, E) and nestin (green; E) in the SVZ. (H–K) Double immunofluorescence for IL-15 (red; H, J and I, K) and GFAP (green; J) or DCX (green; K) in the RMS. (J*, K*) Inset: magnification of IL-15 colocalization in GFAP− cells (J*; white arrowhead) and DCX+ cells (K*; white arrowhead). Nuclei are stained with Hoechst (blue). Fluorescent sections are evaluated with confocal microscopy. Scale bar in A–E and G–K, 50 μm (shown in A, B, D, G, J, K); in F, 100 μm.
FIGURE 2:
FIGURE 2:
Neurogenesis is decreased in IL-15−/− mice. (A–D) Immunohistochemical analysis of the incorporation of BrDU in the SVZ (A, B) and the RMS (C, D) of WT (A, C) and IL-15−/− (B, D) mice. (E, F) Quantification of BrDU+ nuclei in the SVZ (E) and the RMS (F) of WT and IL-15−/− mice, expressed as mean ± SEM of BrDU+ nuclei/mm2. (G–J) Immunohistochemical analysis of the incorporation of BrDU in the SVZ (G, H) and the RMS (I, J) of WT (G, I) and IL-15−/− (H, J) mice. (K, L) Quantification of the DCX+ area in the SVZ (K) and the RMS (L) of WT and IL-15−/− mice, expressed as mean ± SEM of percent DCX+ area. Scale bar in A–D and G–J, 50 μm. Statistical differences of WT vs. IL-15−/−: *p < 0.05, **p < 0.01. Data were analyzed with an analysis of variance (ANOVA) and a post hoc Tukey test.
FIGURE 3:
FIGURE 3:
Intraventricular IL-15 increases NSC proliferation and rescues IL-15−/− phenotype. Dual-pulse (BrDU/EdU) analysis of the effect of IL-15 on NSC proliferation in WT and IL-15−/− mice (see experimental scheme at top right corner). (A–L) Double immunofluorescence for EdU (green) and BrdU (red) in the SVZ of WT (A–C, G–I) and IL-15−/− (D–F, J–L) mice after treatment with ICV PBS (A–F) or IL-15 (1 μg/5 μl; G–L). (M) Quantification of the effect of the ICV injection of PBS (black bars) or IL-15 (white bars) on the proliferative activity in the SVZ of WT or IL-15−/− mice, as mean ± SEM of BrdU/EdU+ nuclei ratio. (N–Q) Double immunofluorescence for EdU (green) and BrdU (red) in the RMS of WT (N, P) and IL-15−/− (O, P) mice after treatment with ICV PBS (N, O) or IL-15 (1 μg/5 μl; P, Q). (R) Quantification of the effect of the ICV injection of PBS (black bars) or IL-15 (white bars) on the proliferative activity in the RMS of WT or IL-15−/−mic, as mean ± SEM of BrdU/EdU+ nuclei ratio. Magnifications are shown in the low right-hand insert. Nuclei are stained with Hoechst (blue). Immunopositive nuclei counting was delimited to the RMS perimeter (dotted line), established using Hoechst staining. Fluorescent sections were evaluated with confocal microscopy. Scale bar in A–L, 20 μm (shown in L); in N–Q, 50 μm (shown in Q). Statistical differences of PBS vs. IL-15: **p < 0.01. Data were analyzed with an ANOVA and a post hoc Tukey test.
FIGURE 4:
FIGURE 4:
Intraventricular IL-15 increases the pool of neuroblasts and rescues IL-15−/− phenotype. Analysis of the effect of IL-15 on neurogenesis in WT and IL-15−/− mice (see experimental scheme at top right corner). (A–L) Double immunofluorescence for DCX (green) and GFAP (red) in the SVZ of WT (A–C, G–I) and IL-15−/− (D–F, J–L) mice after treatment with ICV PBS (A–F) or IL-15 (1 μg/5 μl; G–L). (M, N) Quantification of the effect of the ICV injection of PBS (black bars) or IL-15 (white bars) on the expression of DCX (M) and GFAP (N) in the SVZ of WT or IL-15–/– mice, as mean ± SEM of percent positive area. (O–R) Double immunofluorescence for DCX (green) and GFAP (red) in the RMS of WT (O, Q) and IL-15−/− (P, R) mice after treatment with ICV PBS (O, P) or IL-15 (1 μg/5 μl; Q, R). (S, T) Quantification of the effect of the ICV injection of PBS (black bars) or IL-15 (white bars) on the expression of DCX (M) and GFAP (N) in the RMS of WT or IL-15−/− mice as mean ± SEM of percent positive area. Nuclei are stained with Hoechst (blue). Fluorescent sections are evaluated with confocal microscopy. Scale bar in A–L, 20 μm (shown in L); in O–R, 50 μm (shown in R). Statistical differences of PBS vs. IL-15: *p < 0.05, **p < 0.01. Data were analyzed with an ANOVA and a post hoc Tukey test.
FIGURE 5:
FIGURE 5:
IL-15 is expressed in neurospheres during proliferation and differentiation. (A–F) Immunocytochemical analysis of the expression of IL-15 (red; A, C, D, F) in nestin-positive (green; B, C) or DCX-positive (green; E, F) cells. Magnifications are shown in the right-hand inset, indicating colocalization with white arrowheads. Nuclei are stained with Hoechst (blue). Neurospheres were evaluated with confocal microscopy. Scale bar in A–F, 20 μm (shown in F). (G) RT-PCR analysis of IL-15 mRNA expression under proliferative culture conditions (+EGF, +FGF) at 24, 48, and 72 h. Resting neurospheres (without EGF or FGF) were used as control (CTL). GAPDH expression was used as housekeeping gene. (H) RT-PCR analysis of IL-15 mRNA expression under differentiation culture conditions (+2% FBS) at 4, 7, and 10 d. Proliferative neurospheres (+EGF, +FGF) were used as control. Glyceraldehyde 3-phosphate dehydrogenase (GAPDH) expression was used as housekeeping gene.
FIGURE 6:
FIGURE 6:
IL-15 regulates proliferation and self-renewal of NSCs. (A) Effect of IL-15 on the proliferation of neurospheres, evaluated by the MTT assay. Cells were cultured in incomplete medium (CTL) or incomplete medium supplemented with IL-15 (5 ng/ml) for 24, 48, or 72 h. Data are expressed as mean ± SEM of optical density (OD) 595 nm. (B) Effect of IL-15 deficiency on the proliferation of neurospheres, evaluated by the MTT assay. WT or IL-15 knockout cells were cultured in complete medium for 24, 48, or 72 h. Data are expressed as mean ± SEM of OD 595 nm. (C) Western blotting analysis of the expression of the cell cycle regulators cyclin D1, cyclin D3, CDK4, CDK6, phospho Rb (pRb), phospho histone H3 (pHH3), p21, p27, and p15, using GAPDH as housekeeping gene. WT or IL-15 knockout (KO) neurospheres were cultured for 12, 24, or 48 h in complete medium to further analyze protein expression. (D) Phase contrast analysis of neurosphere size after a self-renewal assay. WT (black bars) and IL-15 knockout (white bars) cells were cultured in complete medium for 7 d to quantify the number of individual cells able to generate a neurosphere (E) and the size of the generated neurospheres (F). (E) Data are expressed as mean ± SEM of the number of neurospheres/well when 5, 50 or 500 cells/well were initially plated. (F) Data are expressed as mean ± SEM of the neurosphere diameter (μm). Scale bar in D, 50 μm. Statistical differences of CTL vs. IL-15 (A), WT vs. IL15 knockout (B, E, F): *p < 0.05, **p < 0.01, ***p < 0.001. Data were analyzed with an ANOVA and a post hoc Tukey test.
FIGURE 7:
FIGURE 7:
IL-15 regulates neurosphere differentiation state. (A) Western blotting analysis of the expression of markers of astrocytes (GFAP), neurons (βIII tubulin), oligodendrocytes (MBP), and neural progenitor cells (DCX) in WT and IL-15 knockout NSCs cultured in differentiating conditions (2% FBS; poly-l-lysine) for 4, 7, or 10 d. (B) Immunocytochemical analysis of the cellular proportions during differentiation of NSCs of WT or IL-15 KO cells. Cells were cultured in differentiating medium (2% FBS; poly-l-lysine) for 4, 7, or 10 d and analyzed for the percent of neurons (βIII tubulin+; black bars), astrocytes (GFAP+; white bars), or oligodendrocytes (O4+; gray bars), expressing data as mean ± SEM of positive cells. Statistical differences of WT vs. IL-15−/−: *p < 0.05. Data were analyzed with an ANOVA and a post hoc Tukey test.
FIGURE 8:
FIGURE 8:
IL-15 regulates the activation of the ERK and JAK/STAT signaling pathways. (A) Western blotting analysis of the activation of the ERK MAPK pathway. The activation of ERK1 and ERK2 is represented by the phosphorylation degree (up; pERK1/2) in relation to the total protein (down; ERK1/2). (B) Western blotting analysis of the activation of the JAK/STAT pathway. The activation of STAT1, STAT3, and STAT5 is represented by the phosphorylation degree (pSTAT1, pSTAT3, pSTAT5) in relation to the total protein (STAT1, STAT3, STAT5). WT and IL-15 KO neurospheres were treated with complete medium for 5, 10, and 20 min, using cells treated with incomplete medium as controls (WT CTL, IL-15 KO CTL). (C) Effect of the inhibition of IL-15 signaling on the proliferation of neurospheres was evaluated by the MTT assay. In the control conditions, cells were cultured in incomplete medium (CTL) or incomplete medium supplemented with IL-15 (5 ng/ml) for 72 h. Alternatively, cells were treated with PD98059, AG-490, or the combination. Data are expressed as mean ± SEM of OD 595 nm. Statistical differences of CTL vs. IL-15: **p < 0.01. Data were analyzed with an ANOVA and a post hoc Tukey test.

Similar articles

Cited by

References

    1. Aarum J, Sandberg K, Haeberlein SL, Persson MA. Migration and differentiation of neural precursor cells can be directed by microglia. Proc Natl Acad Sci USA. 2003;100:15983–15988. - PMC - PubMed
    1. Adunyah SE, Wheeler BJ, Cooper RS. Evidence for the involvement of LCK and MAP kinase (ERK-1) in the signal transduction mechanism of interleukin-15. Biochem Biophys Res Commun. 1997;232:754–758. - PubMed
    1. Alvarez-Buylla A, Garcia-Verdugo JM, Tramontin AD. A unified hypothesis on the lineage of neural stem cells. Nat Rev Neurosci. 2001;2:287–293. - PubMed
    1. Bauer S. Cytokine control of adult neural stem cells. Ann NY Acad Sci. 2009;1153:48–56. - PubMed
    1. Beck RD, Jr, Wasserfall C, Ha GK, Cushman JD, Huang Z, Atkinson MA, Petitto JM. Changes in hippocampal IL-15, related cytokines, and neurogenesis in IL-2 deficient mice. Brain Res. 2005;1041:223–230. - PubMed

Publication types

MeSH terms

LinkOut - more resources